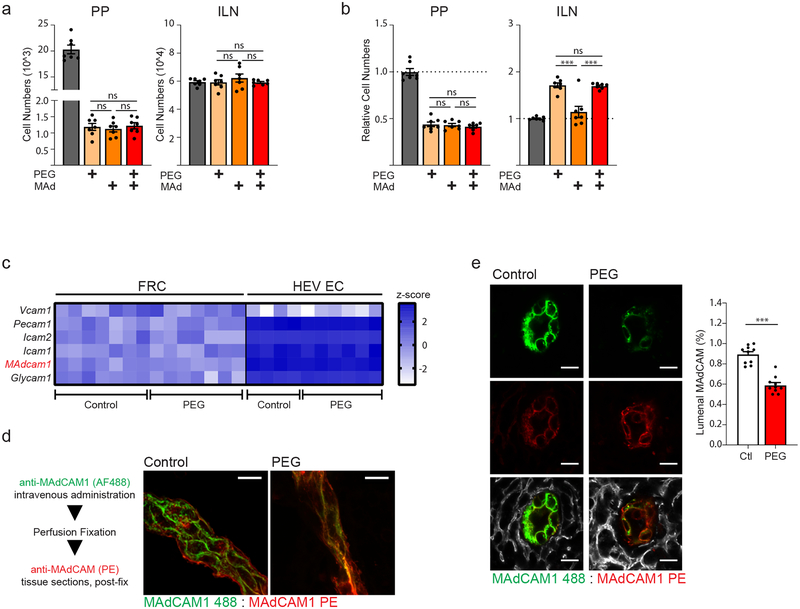
Figure 5. Impaired lymphocyte rolling on HEV and reduced lumenal display of MAdCAM on the HEV surface following loss of PP conduit flow.
(a,b) Mice were untreated, treated with PEG, treated by IV injection of anti-MAdCAM, or treated with both PEG and anti-MAdCAM. (n=7 mice per group) (a) Accumulation of adoptively transferred lymphocytes to the PP or ILN 1 hour after transfer. (b) Total lymphocyte cellularity of the PP and ILN following treatment. (c) Expression heat-map of select adhesion molecules involved in lymphocyte recruitment. RNAseq was performed on FACS sorted FRCs and HEV ECs from both control and PEG-treated animals. Data represented as Z-score (n= 7 mice per group (FRC) or 4 mice per group (HEV EC)). (d,e) Mice were in vivo labeled with anti-MAdCAM in alexafluor 488 by intravenous injection. Mice were perfused with fixative and tissue sections from PPs were re-stained with anti-MAdCAM in PE. (d) Confocal microscopy of an HEV (longitudinal orientation) from a control (untreated) and PEG-treated mouse. Representative of three independent experiments (e) Representative image taken by confocal microscopy of PP HEVs (cross-sectional orientation) from control and PEG-treated mice Cumulative data is quantified and displayed as percentage of pixels positive in MAdCAM-AF488 out of total MAdCAM+ pixels (% lumenal MAdCAM). Scale bars = 10um. (n=10 mice per group) For all graphs, data represented as mean ± SEM from three independent experiments. Groups were compared by one way ANOVA (a,b) or unpaired two tailed Student’s t test (e). *P < 0.05, **P < 0.01, ****P < 0.0001. No statistical significance is indicated with “ns”

