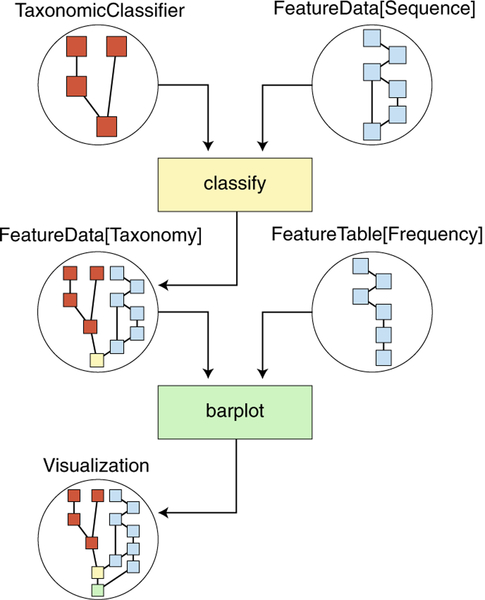
Fig. 2 |. QIIME 2 iteratively records data provenance, ensuring bioinformatics reproducibility.
This simplified diagram illustrates the automatically tracked information regarding the creation of the taxonomy bar plot presented in Fig. 1b. QIIME 2 results (circles) contain network diagrams illustrating the data provenance stored in the result. Actions (quadrilaterals) are applied to QIIME 2 results and generate new results. Arrows indicate the flow of QIIME 2 results through actions. TaxonomicClassifier and FeatureData[Sequence] inputs contain independent provenance (red and blue, respectively) and are provided to a classify action (yellow), which taxonomically annotates sequences. The result of the classify action, a FeatureData[Taxonomy] result, integrates the provenance of both inputs with the classify action. This result is then provided to the barplot action with a FeatureTable[Frequency] input, which shares some provenance with the FeatureData[Sequence] input, because they were generated from the same upstream analysis. The resulting visualization (Fig. 1b) has the complete data provenance and correctly identifies shared processing of inputs. This simplified representation was created manually from the complete provenance graph for the purpose of illustration. An interactive and complete version of this provenance graph (as well as those for other Fig. 1 panels) can be accessed through Supplementary File 1.

