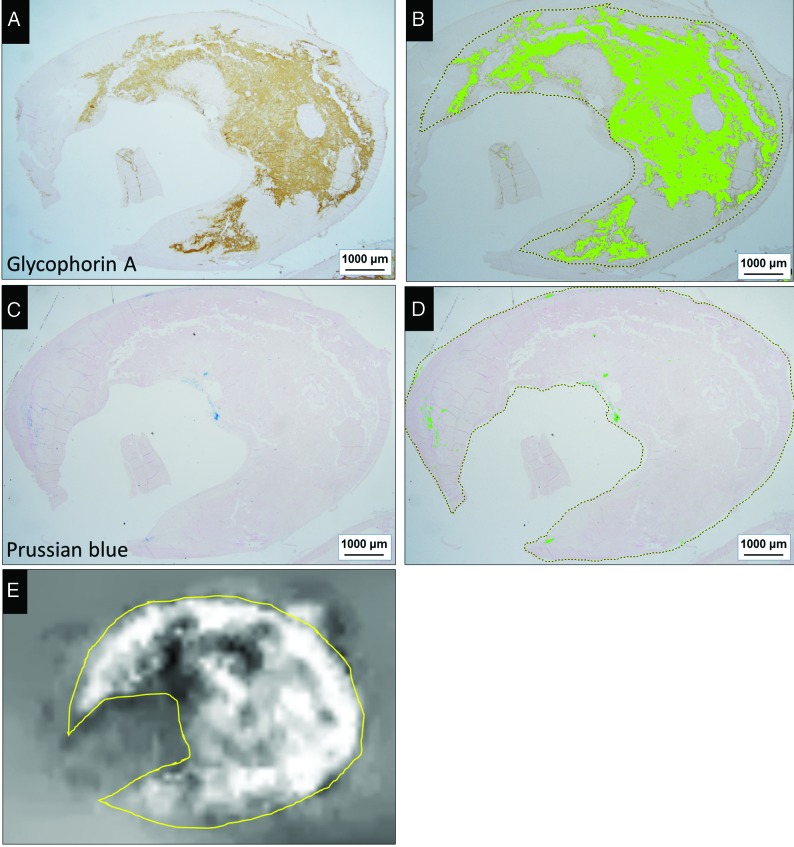
FIG 4.
Correlative analysis of erythrocytes and iron deposits on histologic sections from a 73-year-old man (A–D) and the SV on the QSM image of whole plaque (E). Areas positive for GYPA staining (A) and color extraction (B) were relatively well-correlated with the distribution of hyperintensity on the QSM image (E). There are a few small areas positive for Prussian blue staining (C) and color extraction (D). Positively stained areas were extracted under specific protocols using the hue of the color and its lightness and saturation. Data are expressed as the ratio (percentage) of extracted green areas relative to the whole plaque (dashed outline in B and D). The ROI on the QSM image (yellow outline, E) is matched with the histologic ROI for measuring the mean SV of the whole plaque.

