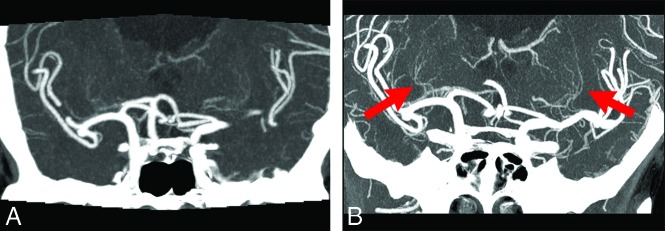
FIG 3.
A 74-year-old woman with bilateral MCA aneurysms. A, C-CTA of a coronal partial MIP (20 mm) image. B, UHR-CTA of a coronal partial MIP (20 mm) image. UHR-CTA shows bilateral LSAs more clearly (arrows), and it allows accurate assessment of the variation and structure of the LSAs compared with C-CTA.

