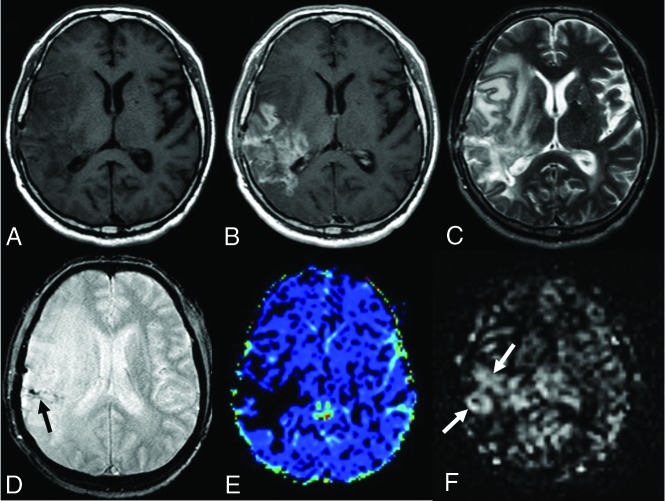
FIG 3.
A 49-year-old male patient who underwent an operation and received chemoradiotherapy due to a glioblastoma in the temporoparietal region 1 year ago. T1-weighted (A) and T2-weighted (C) MR images show postoperative changes and alterations in the signal intensities in the right temporoparietal region. The postcontrast image (B) shows wide-scale enhancement in the site of the operation. The T2*-weighted image (D) shows hypointensities secondary to old bleeding residues (black arrow). The DSC perfusion map (E) shows a large perfusion signal loss caused by leakage artifacts in the contrasted areas (DSC rrCBF = 1.3). In the mpASL perfusion map (F), there is a significant increase in perfusion at the site of the operation (white arrows) (ASL rrCBF = 3.5). The patient was diagnosed with a recurrent glioblastoma after the second operation.

