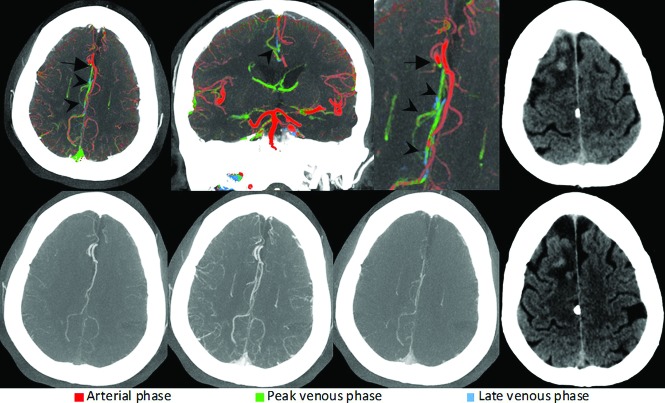
FIG 5.
Right-sided A2 segment ACA occlusion (arrows). ColorViz summation images (upper row) show green and blue vessels distal to the occlusion (arrowheads), indicating impaired arterial filling within the right ACA territory. Corresponding conventional mCTA images are shown in the lower row. The patient received intravenous alteplase. Follow-up CT after 24 hours (upper and lower right) shows infarction in the right ACA territory.

