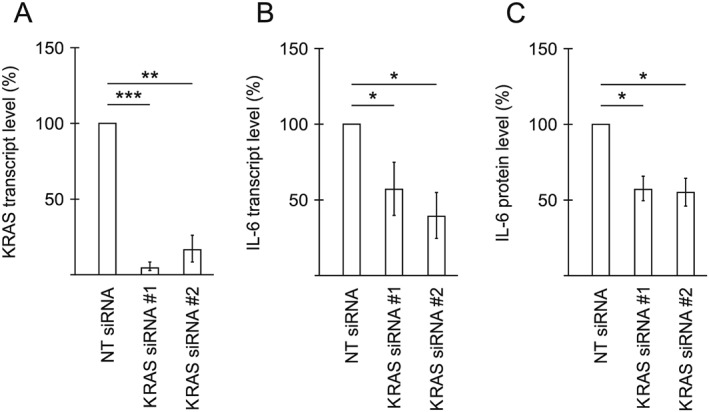
Figure 2.

KRAS affects the secretion of the autophagy‐inducing cytokine IL‐6 from TOV21G cells. (A) KRAS transcript level in TOV21G cells treated with two different siRNAs targeting KRAS, 1 day post‐transfection, relative to non‐targeting (NT) siRNA‐treated TOV21G cells. Measured using qPCR. Mean from three independent experiments ±SD. *** P < 0.0005 and ** P < 0.005 vs. NT siRNA (Student's t‐test). (B) IL‐6 transcript level in TOV21G cells treated with siRNAs targeting KRAS, 1 day post‐transfection, relative to NT siRNA‐treated TOV21G cells. Measured using qPCR. Mean from three independent experiments ±SD. * P < 0.05 vs. NT siRNA (Student's t‐test). (C) Relative level of IL‐6, measured using an ELISA assay, in CM from TOV21G cells treated with NT siRNA or siRNAs targeting KRAS. CM was harvested 1 day post‐transfection. Mean from three experiments ±SD. * P < 0.05 vs. NT siRNA (Student's t‐test).
