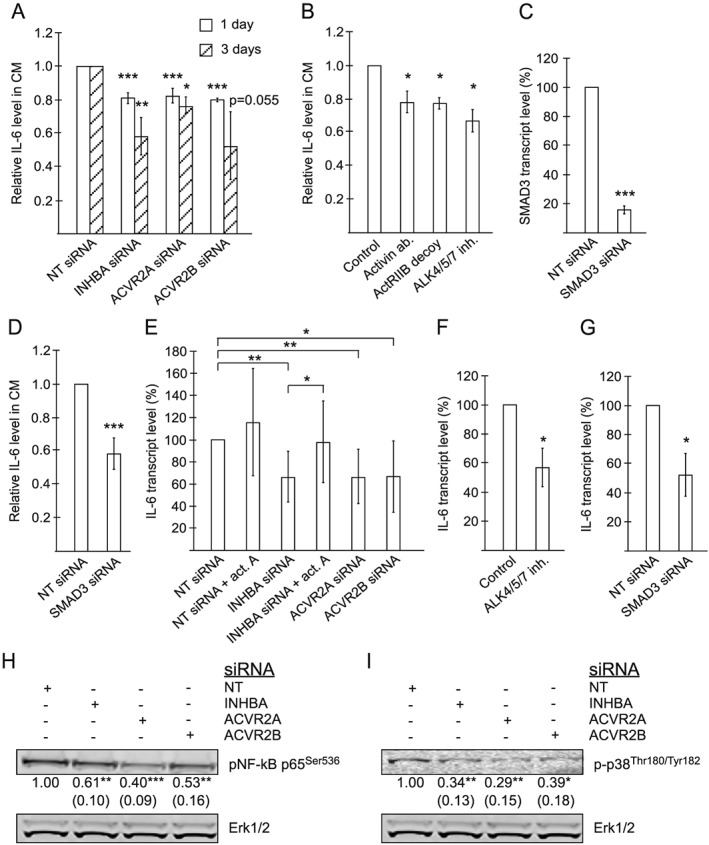
Figure 3.

Activin A affects the secretion of the autophagy‐inducing cytokine IL‐6 from TOV21G cells. (A) Relative level of IL‐6, measured using an ELISA assay, in CM from TOV21G cells treated with non‐targeting (NT) siRNA or siRNA targeting INHBA, ACVR2A, or ACVR2B. CM was harvested 1 or 3 days post‐transfection. Mean from three experiments [ACVR2A (3 days) and ACVR2B (1 day and 3 days)], four experiments [ACVR2A (1 day) and INHBA (3 days)], or six experiments [INHBA (1 day)] ±SD. * P < 0.05, ** P < 0.005, *** P < 0.0005 vs. respective NT siRNA (Student's t‐test). (B) Relative level of IL‐6, measured using an ELISA assay, in CM from TOV21G cells treated with 1.6 μg/mL activin neutralizing antibody, 1.8 μg/mL ActRIIB decoy receptor, or 10 μM ALK4/5/7 inhibitor (SB431542). CM was harvested after 1 day of treatment. Mean from three experiments ±SD. * P < 0.05 vs. control (Student's t‐test). (C) SMAD3 transcript level in TOV21G cells treated with siRNA targeting SMAD3, 1 day post‐transfection, relative to NT siRNA‐treated TOV21G cells. Measured using qPCR. Mean from three independent experiments ±SD. *** P < 0.0005 vs. NT siRNA (Student's t‐test). (D) Relative level of IL‐6, measured using an ELISA assay, in CM from TOV21G cells treated with NT siRNA or siRNA targeting SMAD3. CM was harvested 1 day post‐transfection. Mean from six experiments ±SD. *** P < 0.0005 vs. NT siRNA (Student's t‐test). (E) IL‐6 transcript level in TOV21G cells treated with NT siRNA (±50 ng/mL recombinant activin A) or siRNA targeting INHBA (±50 ng/mL recombinant activin A), ACVR2A, or ACVR2B. Measured using qPCR. RNA was isolated 1 or 3 days post‐transfection. Mean from 10 independent experiments (seven for recombinant activin A) ±SD. * P < 0.05, ** P < 0.005 (Student's t‐test). (F) IL‐6 transcript level in TOV21G cells treated with 10 μM ALK4/5/7 inhibitor (SB431542) for 1 day, relative to vehicle‐treated TOV21G cells. Measured using qPCR. Mean from three independent experiments ±SD. * P < 0.05 vs. vehicle (Student's t‐test). (G) IL‐6 transcript level in TOV21G cells treated with siRNA targeting SMAD3, 1 day post‐transfection, relative to NT siRNA‐treated TOV21G cells. Measured using qPCR. Mean from three independent experiments ±SD. * P < 0.05 vs. NT siRNA (Student's t‐test). (H, I) Levels of pNF‐κB p65 (Ser536) and Erk1/2, and p‐p38 (Thr180/Tyr182) and Erk1/2, respectively, in TOV21G cells treated with NT siRNA or siRNA targeting INHBA, ACVR2A, or ACVR2B. Extracts were made 3 days post‐transfection. Representative blots are shown with numbers representing mean values from five [panel (H)] or four [panel (I)] independent experiments (and SD) after normalization against signals from Erk1/2. * P < 0.05, ** P < 0.005, *** P < 0.0005 (Student's t‐test).
