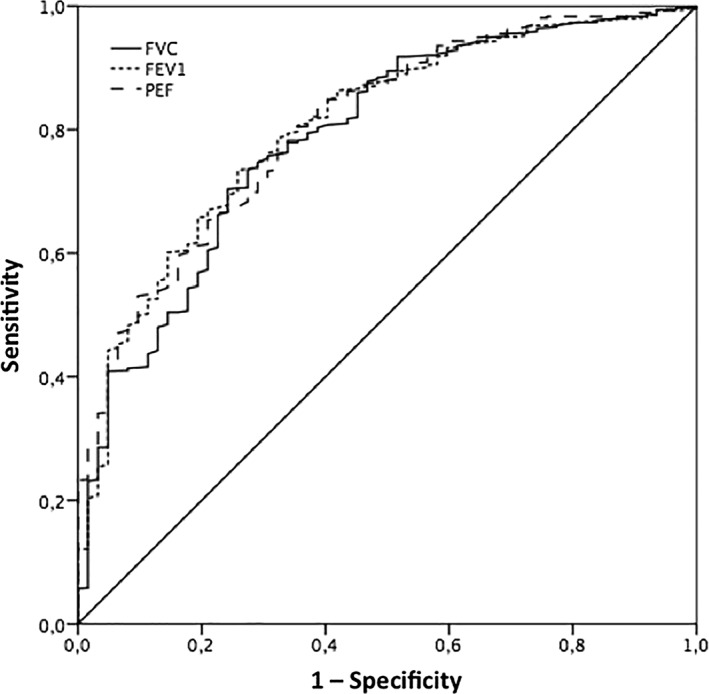
Figure 3.

Receiver operating characteristic curve analysis for predicting sarcopenia (by means of low handgrip strength) according to pulmonary function. The receiver operating characteristic curve analysis revealed that the areas under the curves for FVC, FEV1, and PEF were 0.788, 0.804, and 0.807, respectively. FEV1, forced expiratory volume in 1 s; FVC, forced vital capacity; PEF, peak expiratory flow.
