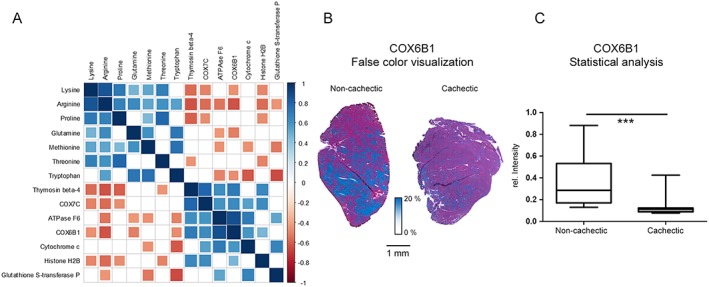
Figure 2.

Evaluation of potential protein breakdown targets. (A) Visualization of Spearman's rank correlation analysis results examining the relationships between amino acids and proteins. Square sizes represent the magnitude of the Spearman's rank correlation coefficient. Blue squares indicate positive correlations, and red squares indicate negative correlations. Non‐significant correlations (P > 0.05) are indicated by empty squares. Many OXPHOS proteins seemed to be degraded. (B) False colour visualization of COX6B1. A reduced quantity of COX6B1 was observed in cachectic mouse tissues, compared with non‐cachectic ones. (C) Statistical analysis of the false colour visualization results depicted in (B). COX6B1 intensities were significantly lower in cachectic mouse muscle tissues than in non‐cachectic ones (P = 0.0008). Boxplot whiskers represent the minimum and maximum intensities. *** P < 0.005.
