Figure 3.

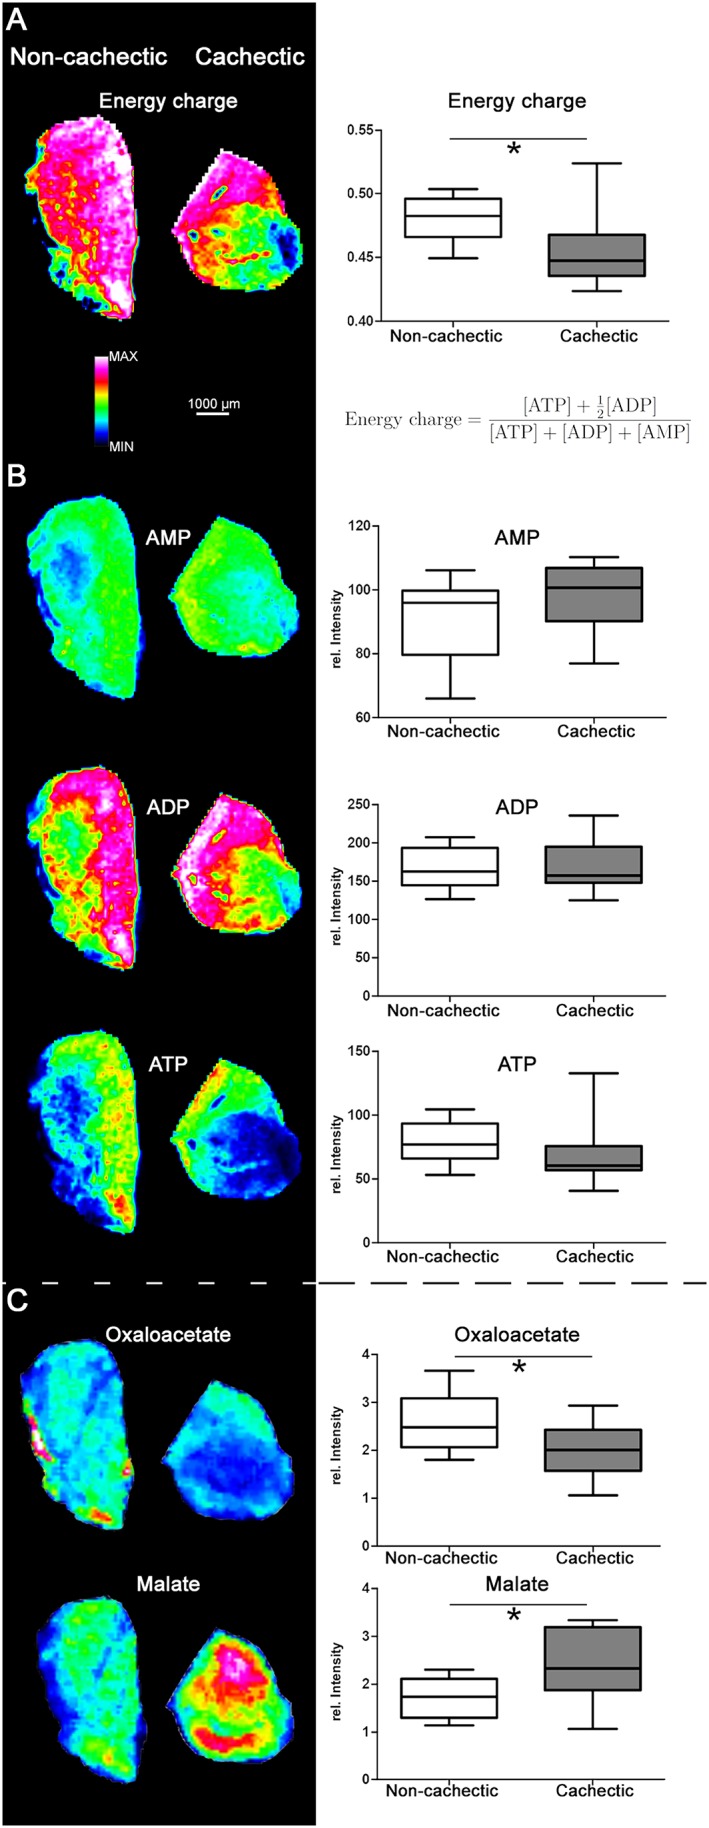
Energy changes in cancer cachexia. (A) Heatmap visualization and statistical analysis of the calculated energy charge. Calculation of the energy charge revealed a significantly lower charge in cachectic mice (P = 0.0101). (B) AMP, ADP, and ATP distribution in cachectic and non‐cachectic mouse skeletal muscle tissues. No significant differences were detected between cachectic and non‐cachectic mouse tissues. (C) Heatmap visualization and statistical analysis of changes in molecules of the tricarboxylic acid cycle. Cachectic mice exhibited significantly higher quantities of malate (P = 0.0295) and lower quantities of oxaloacetate (P = 0.0448) than non‐cachectic mice. Whiskers of the boxplots represent the lowest and highest peak intensities in each group. * P < 0.05.
