Figure 5.

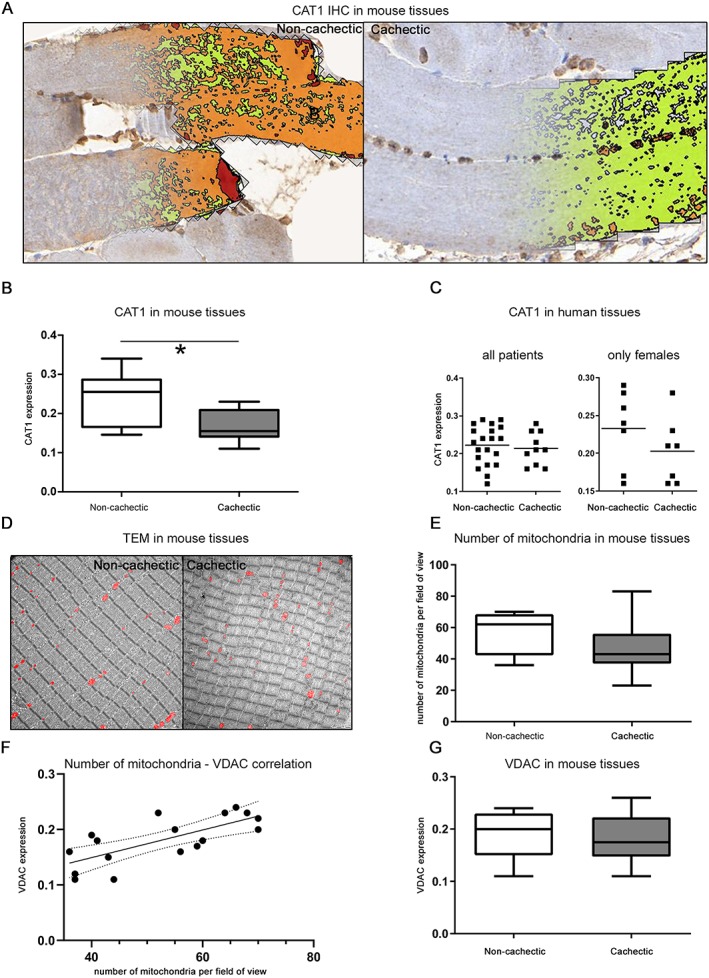
Changes in CAT1 expression in cachexia. (A) Digital image analysis of the CAT1 immunohistochemistry (IHC) results. Definiens Software Developer XD2 was used to detect the CAT1 expression in all tissue sections. (B) The detected CAT1 abundance was significantly lower in skeletal muscles of cachectic mice than in non‐cachectic ones (P = 0.0133). Whiskers of the boxplots represent the lowest and highest CAT1 expression in each group. (C) CAT1 expression in skeletal muscle tissues from humans with cancer for all and only female patients. CAT1 was slightly lower in patients with cachexia, compared with non‐cachectic patients, but the difference did not reach statistical significance. Horizontal lines represent the mean intensity of each group. (D) Number of mitochondria in mouse skeletal muscle tissues determined by transmission electron microscopy (TEM) at 1600× magnification. The red colour represents the mitochondria. Intact mitochondria were observed in tissues from both cachectic and non‐cachectic mice. (E) Boxplots illustrating the number of mitochondria in mouse skeletal muscle tissues. No significant difference was detected between cachectic and non‐cachectic mice. (F) Correlation analysis between the number of mitochondria determined by electron microscopy and the intensity of voltage‐dependent anion channel (VDAC) staining detected by IHC. The number of mitochondria was significantly correlated with VDAC expression (P = 0.0033). (G) Statistical analysis of VDAC staining in muscle tissues from cachectic and non‐cachectic mice. No significant difference was detected. * P < 0.05.
