
Figure 5.
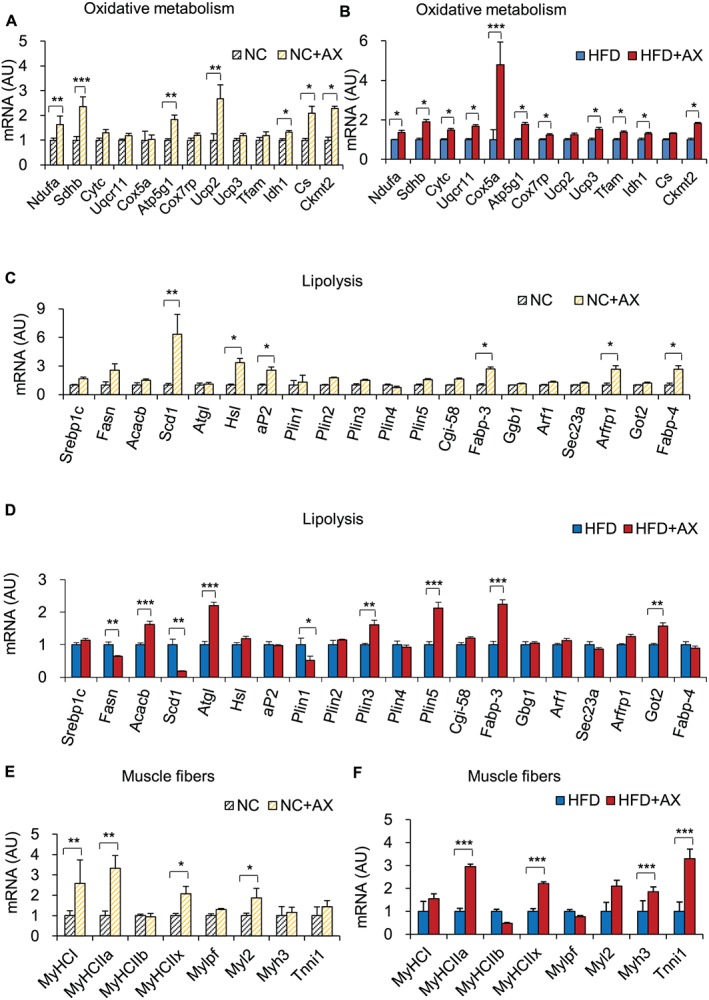
Gene expression analysis in the gastrocnemius skeletal muscle including of TCA/mitochondria function in the muscle of AX‐treated NC mice compared with the control NC mice (A) and AX‐treated HFD mice compared with control HFD mice (B), lipolysis‐related genes in the AX‐treated NC mice compared with the control NC mice (C) and AX‐treated HFD mice compared with control HFD mice (D) and skeletal muscle phenotype in the AX‐treated NC mice compared with the control NC mice (E) and AX‐treated HFD mice compared with control HFD mice (F) (n = 6 per group). All values are presented as the means ± S.E.M.*p < 0.05, **p < 0.01, ***p < 0.001 (HFD vs. HFD+AX) or (NC vs. NC+AX). Statistical analysis was performed using Student's t test.