
Figure 7.
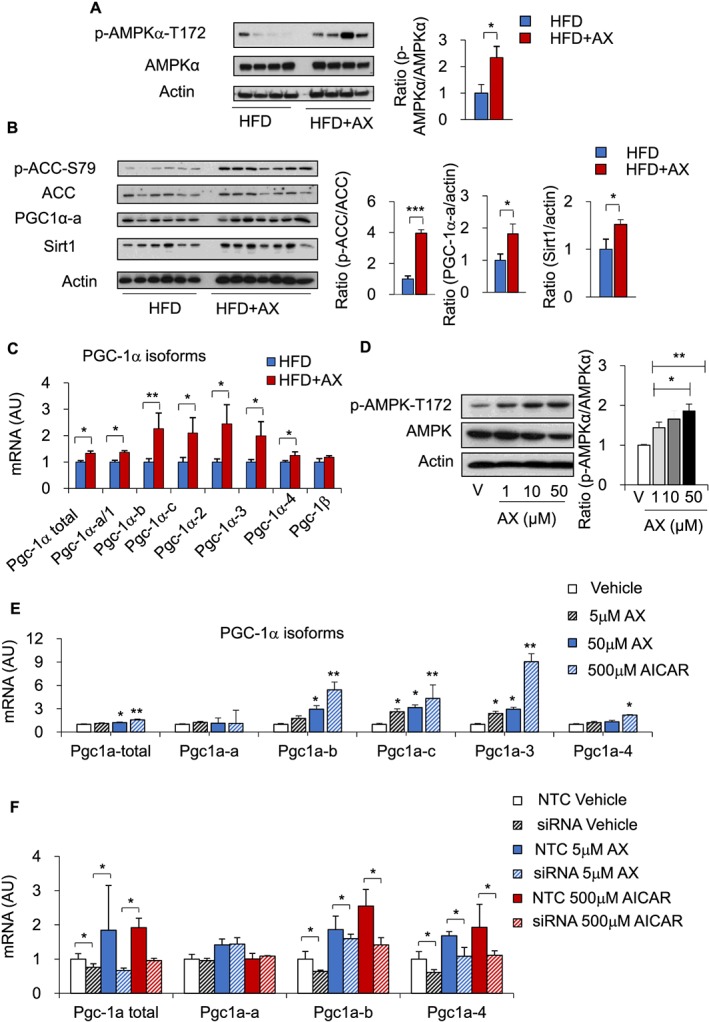
AX activated the mitochondrial metabolic pathway through AMPK activation in the mice fed HFD or HFD+AX for 24 weeks. (A,B) Western blot analysis (left) and quantification of AMPK phosphorylation (right) (A), ACC phosphorylation, PGC‐1α and Sirt1 (B) in the gastrocnemius muscle of mice fed HFD or HFD+AX (left) and quantification (right) (n = 6–7 per group). (C) AX induced mRNA expressions of PGC‐1α variants downstream of AMPK (HFD or HFD+AX for 24 weeks) (n = 6 per group). (D) Dose‐dependent induction of AMPK phosphorylation by AX was observed in the cultured C2C12 cells. The cells were treated with various doses of AX for up to 48h (left) and ratio of p‐AMPKα/AMPKα is given in right panel. (E) Gene expression analysis of the PGC‐1α variants downstream of AMPK treated with different doses of AX compared with vehicle control and AICAR (n = 3–6 in each treatment). (F) Gene expression analysis of the PGC‐1α isforms in siRNA‐AMPKα1/2 treated C2C12 cells compared with non‐target control (NTC) siRNA (n = 3–4 in each treatment). All values are presented as means ± S.E.M.*p < 0.05, **p < 0.01, ***p < 0.001 (HFD vs. HFD+AX) (vehicle vs. AX treatment). Statistical tests were performed as follows: (A–C,F) Student's t test, (D,E) one‐way ANOVA/Dunnett's test.