
Figure 7.
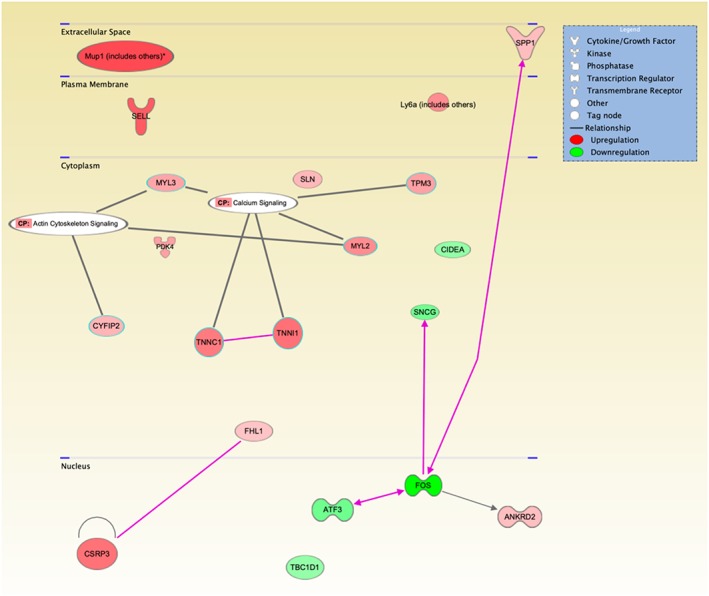
Functional annotation network. Ingenuity Pathway Analysis of alternations in energy metabolism, skeletal and muscular system development and function, and organismal injury and abnormalities in Ctns−/− mice relative to wild‐type mice. The coloured genes in the networks are differentially expressed between Ctns−/− mice relative to wild‐type mice. Node colour represents the expression status. Red: up‐regulated in Ctns−/− mice relative to wild‐type mice; green: down‐regulated in Ctns−/− mice relative to wild‐type mice. Increased expression of genes are ANKRD2, CSRP3, CYFIP2, FHL1, LY6A, MUP1, MYL2, MYL3, PDK4, SELL, SLN, SPP1, TNNC1, TNNI1, and TPM3, and decreased expression of genes are ATF3, CIDEA, FOS, SNCG, and TBC1D1.