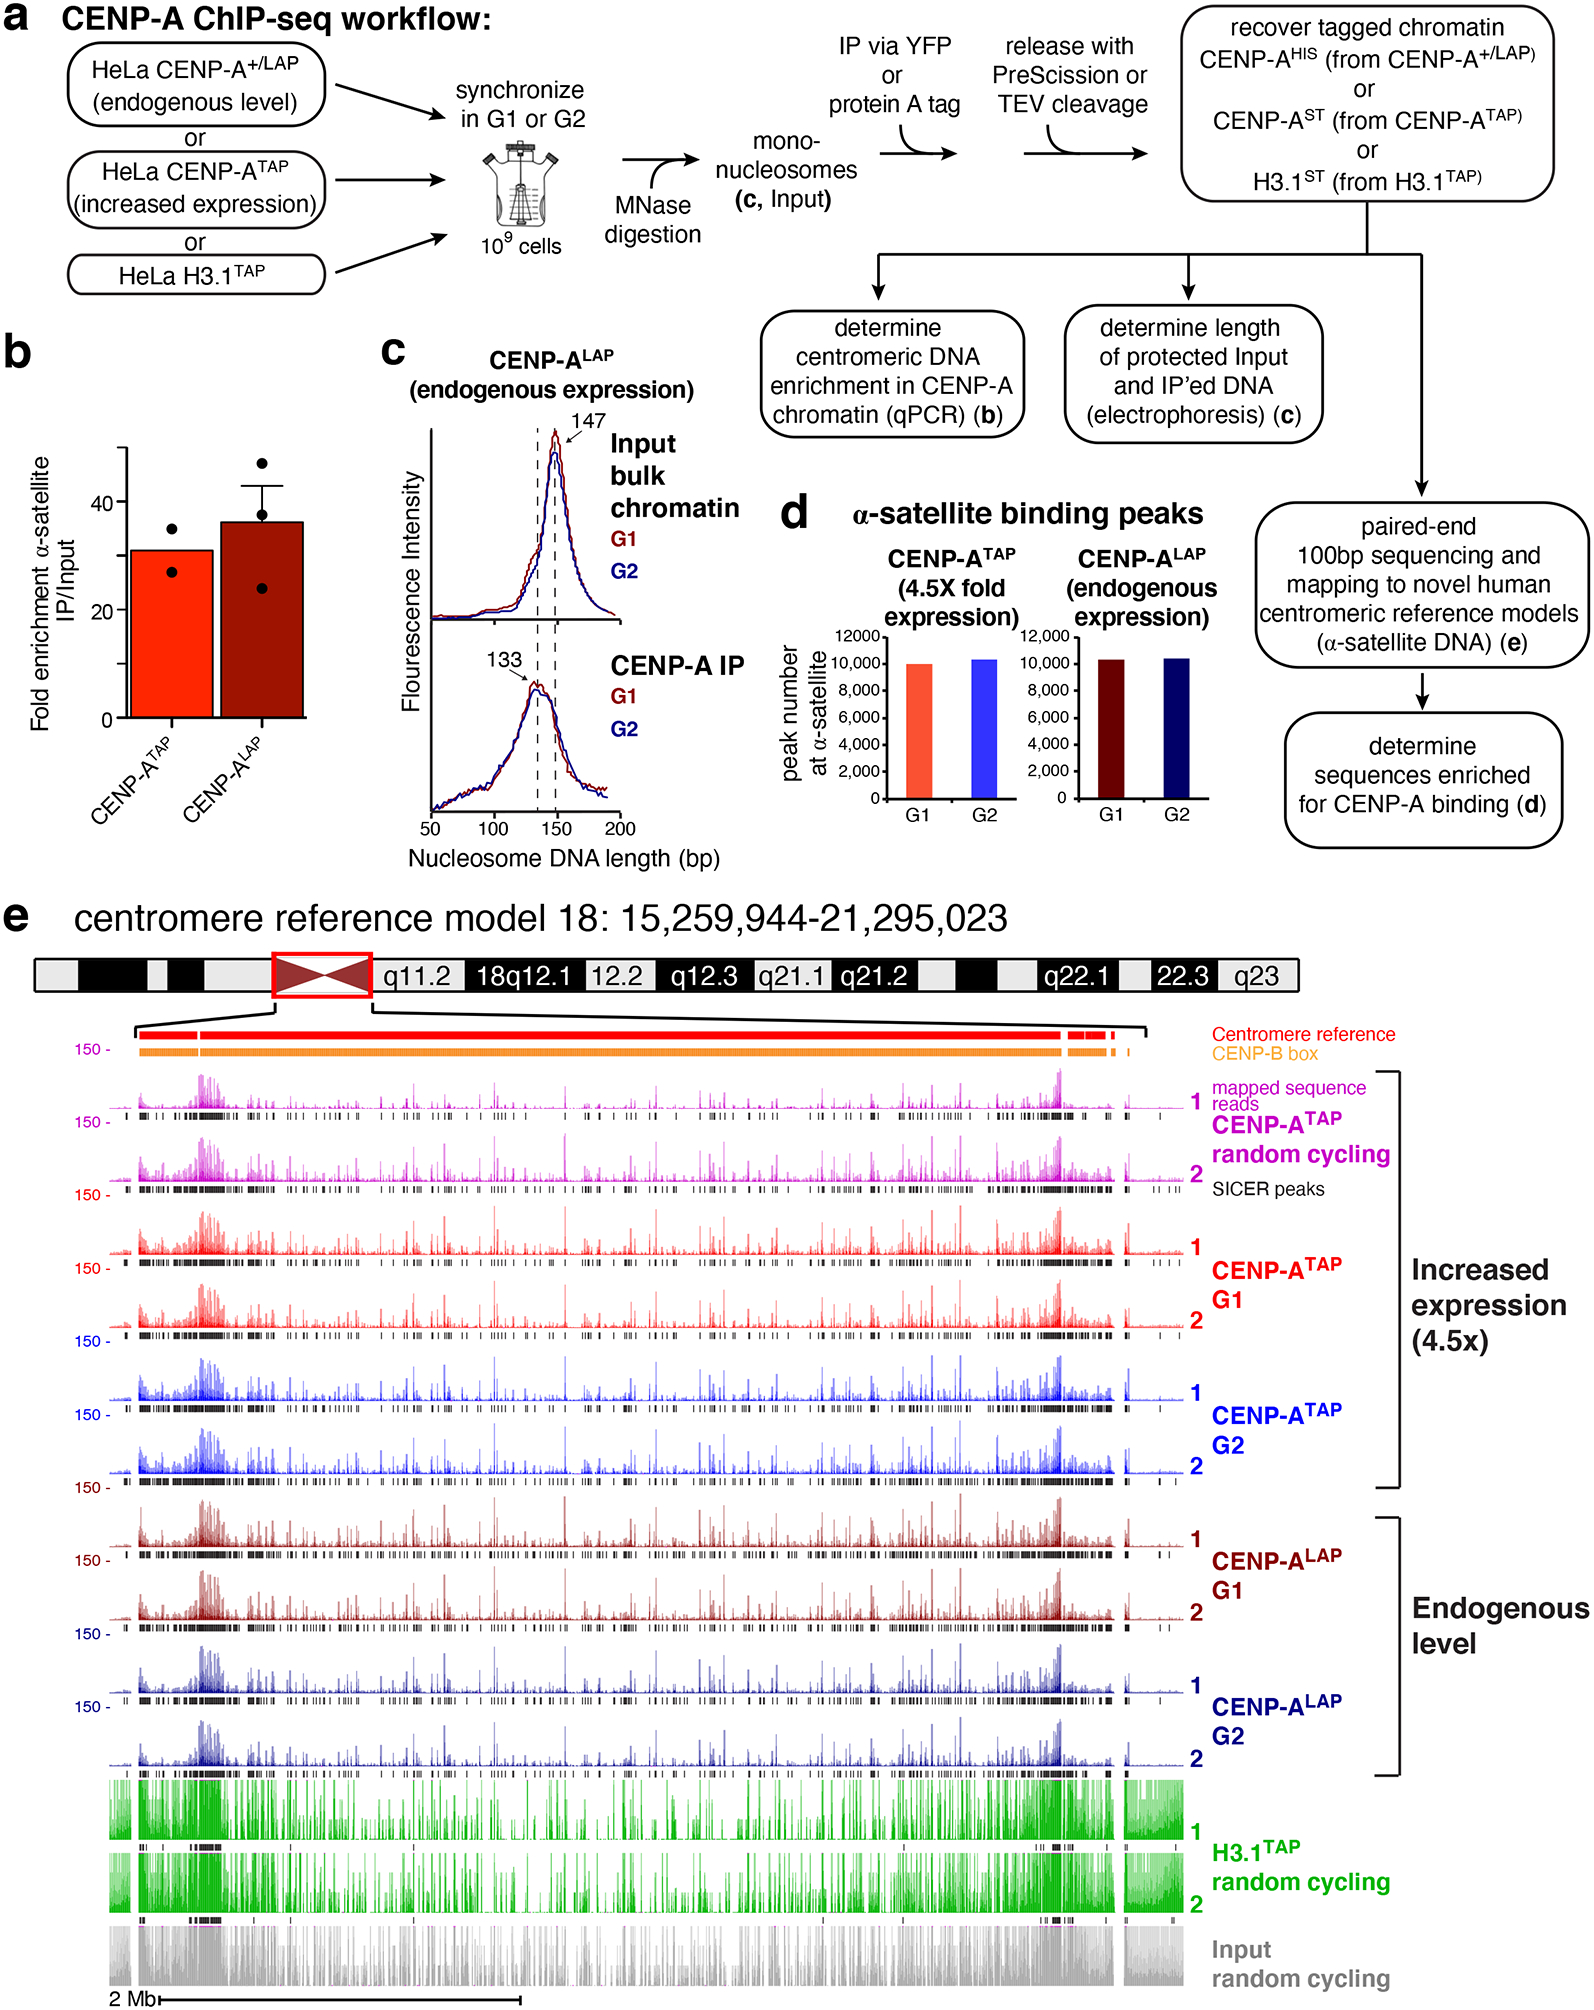
Figure 1. CENP-A ChIP-seq identifies CENP-A binding at reference centromeres of 23 human chromosomes.

(a) CENP-A ChIP-sequencing experimental design. (b) Quantitative real-time PCR for α-satellite DNA in chromosomes 1, 3, 5, 10, 12 and 16. N=2 for CENP-ATAP and 3 for CENP-ALAP, from biologically independent replicates. Error bars, s.e.m. (c) MNase digestion profile showing the nucleosomal DNA length distributions of bulk input mono-nucleosomes (upper panel) and purified CENP-ALAP following native ChIP at G1 and G2. The experiment was repeated independently twice with similar results. (d) Number of CENP-A binding peaks at α-satellite DNA in CENP-ATAP and CENP-A+/LAP cells at G1 and G2. The number represent peaks that are overlapping between the two biologically independent replicates. (e) CENP-A ChIP-seq shows CENP-A binding peaks at the centromere of chromosome 18 for CENP-ALAP and CENP-ATAP before and after DNA replication. CENP-A peaks across the reference model are a result of multi-mapping and their exact linear order is not known. SICER peaks are shown in black below the raw read data. Two replicates are shown for each condition. Scale bar, 2Mb. Source data for b and d can be found in Supplementary Table 4.
