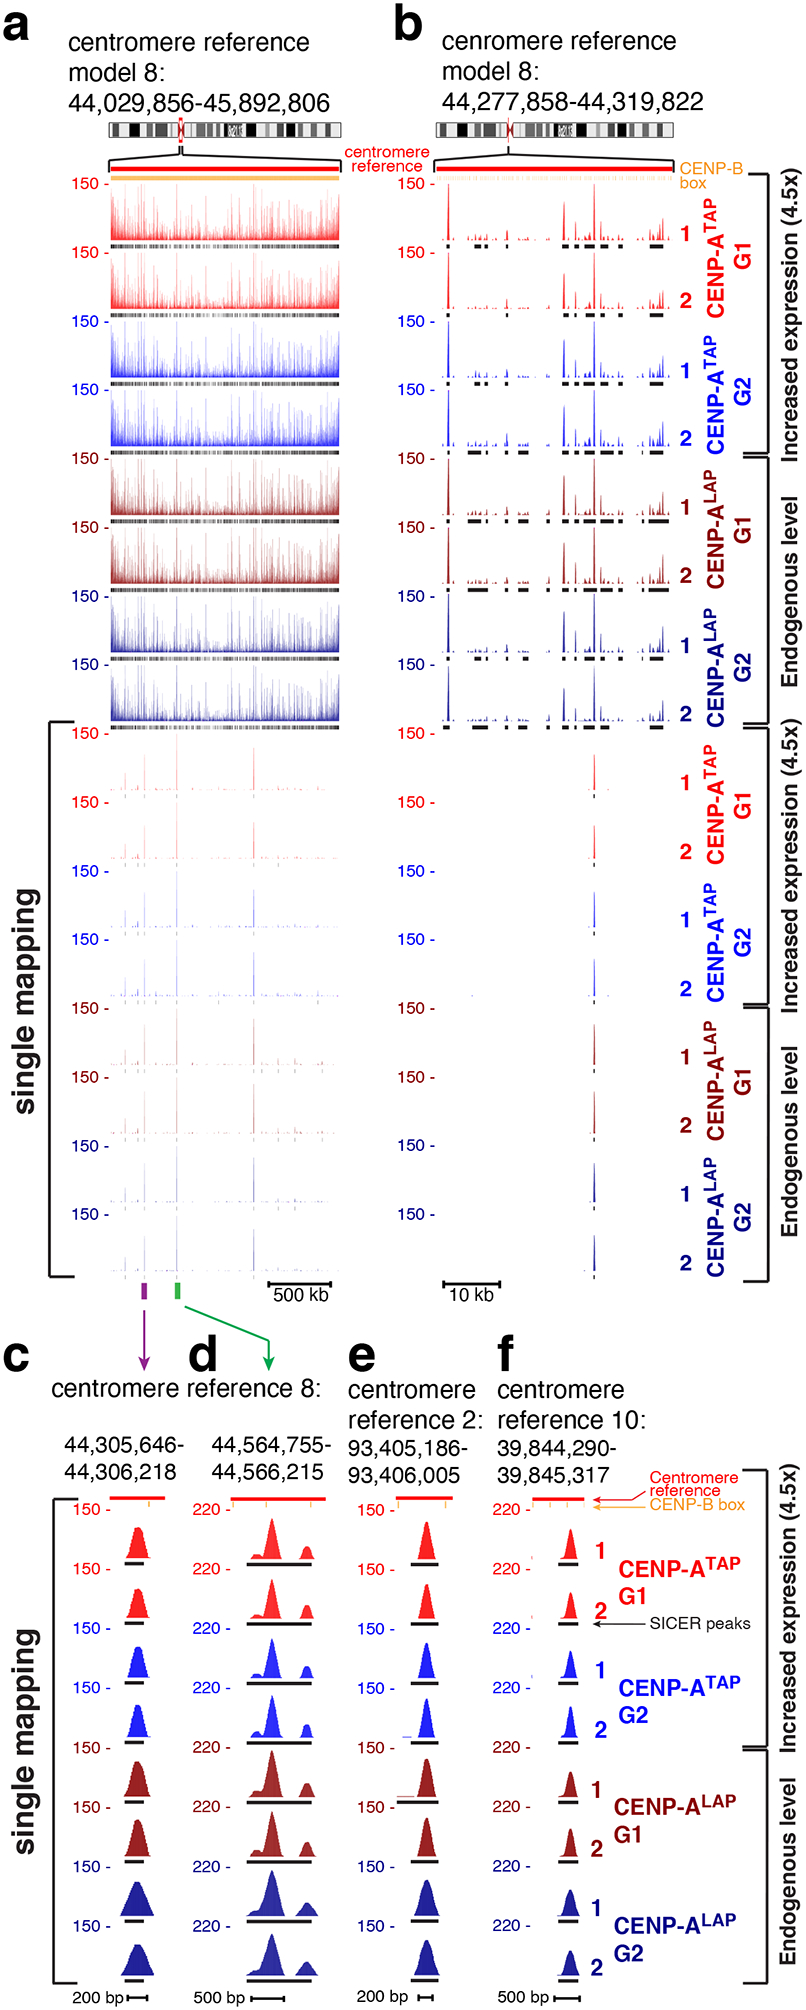
Figure 2. Retention of centromeric CENP-A through DNA replication.

(a, b) CENP-A ChIP-seq raw mapping data (colored) and SICER peaks (black lines, underneath) showing sequences bound by CENP-A (at both endogenous and increased expression levels) across centromere reference model of chromosome 8, before and after DNA replication. Upper part shows mapping of all reads (including reads that are multi-mapping) onto the repetitive α−satellite DNA. Lower part shows read mapping to sites that are single copy in the HuRef genome (single-mapping), after filtering out multi-mapping reads. Centromere reference location, red. CENP-B box location, orange. Scale bar, 500kb (a), 10kb (b). (c) High-resolution view of read mapping to a site that is single copy in centromere reference model of chromosome 8, marked by a purple bar in (a). Scale bar, 200bp. (d) High-resolution view of read mapping to a site that is single copy in centromere reference model of chromosome 8, marked by a green bar in (a). Scale bar, 500bp. (e, f) High-resolution view of read mapping to a site that is single copy in centromere reference model of chromosome 2 (e) and in the centromere reference model of chromosome 10 (f). Scale bar, 200bp (e) and 500bp (f). The experiment shown in (a-f) was repeated independently twice with similar results.
