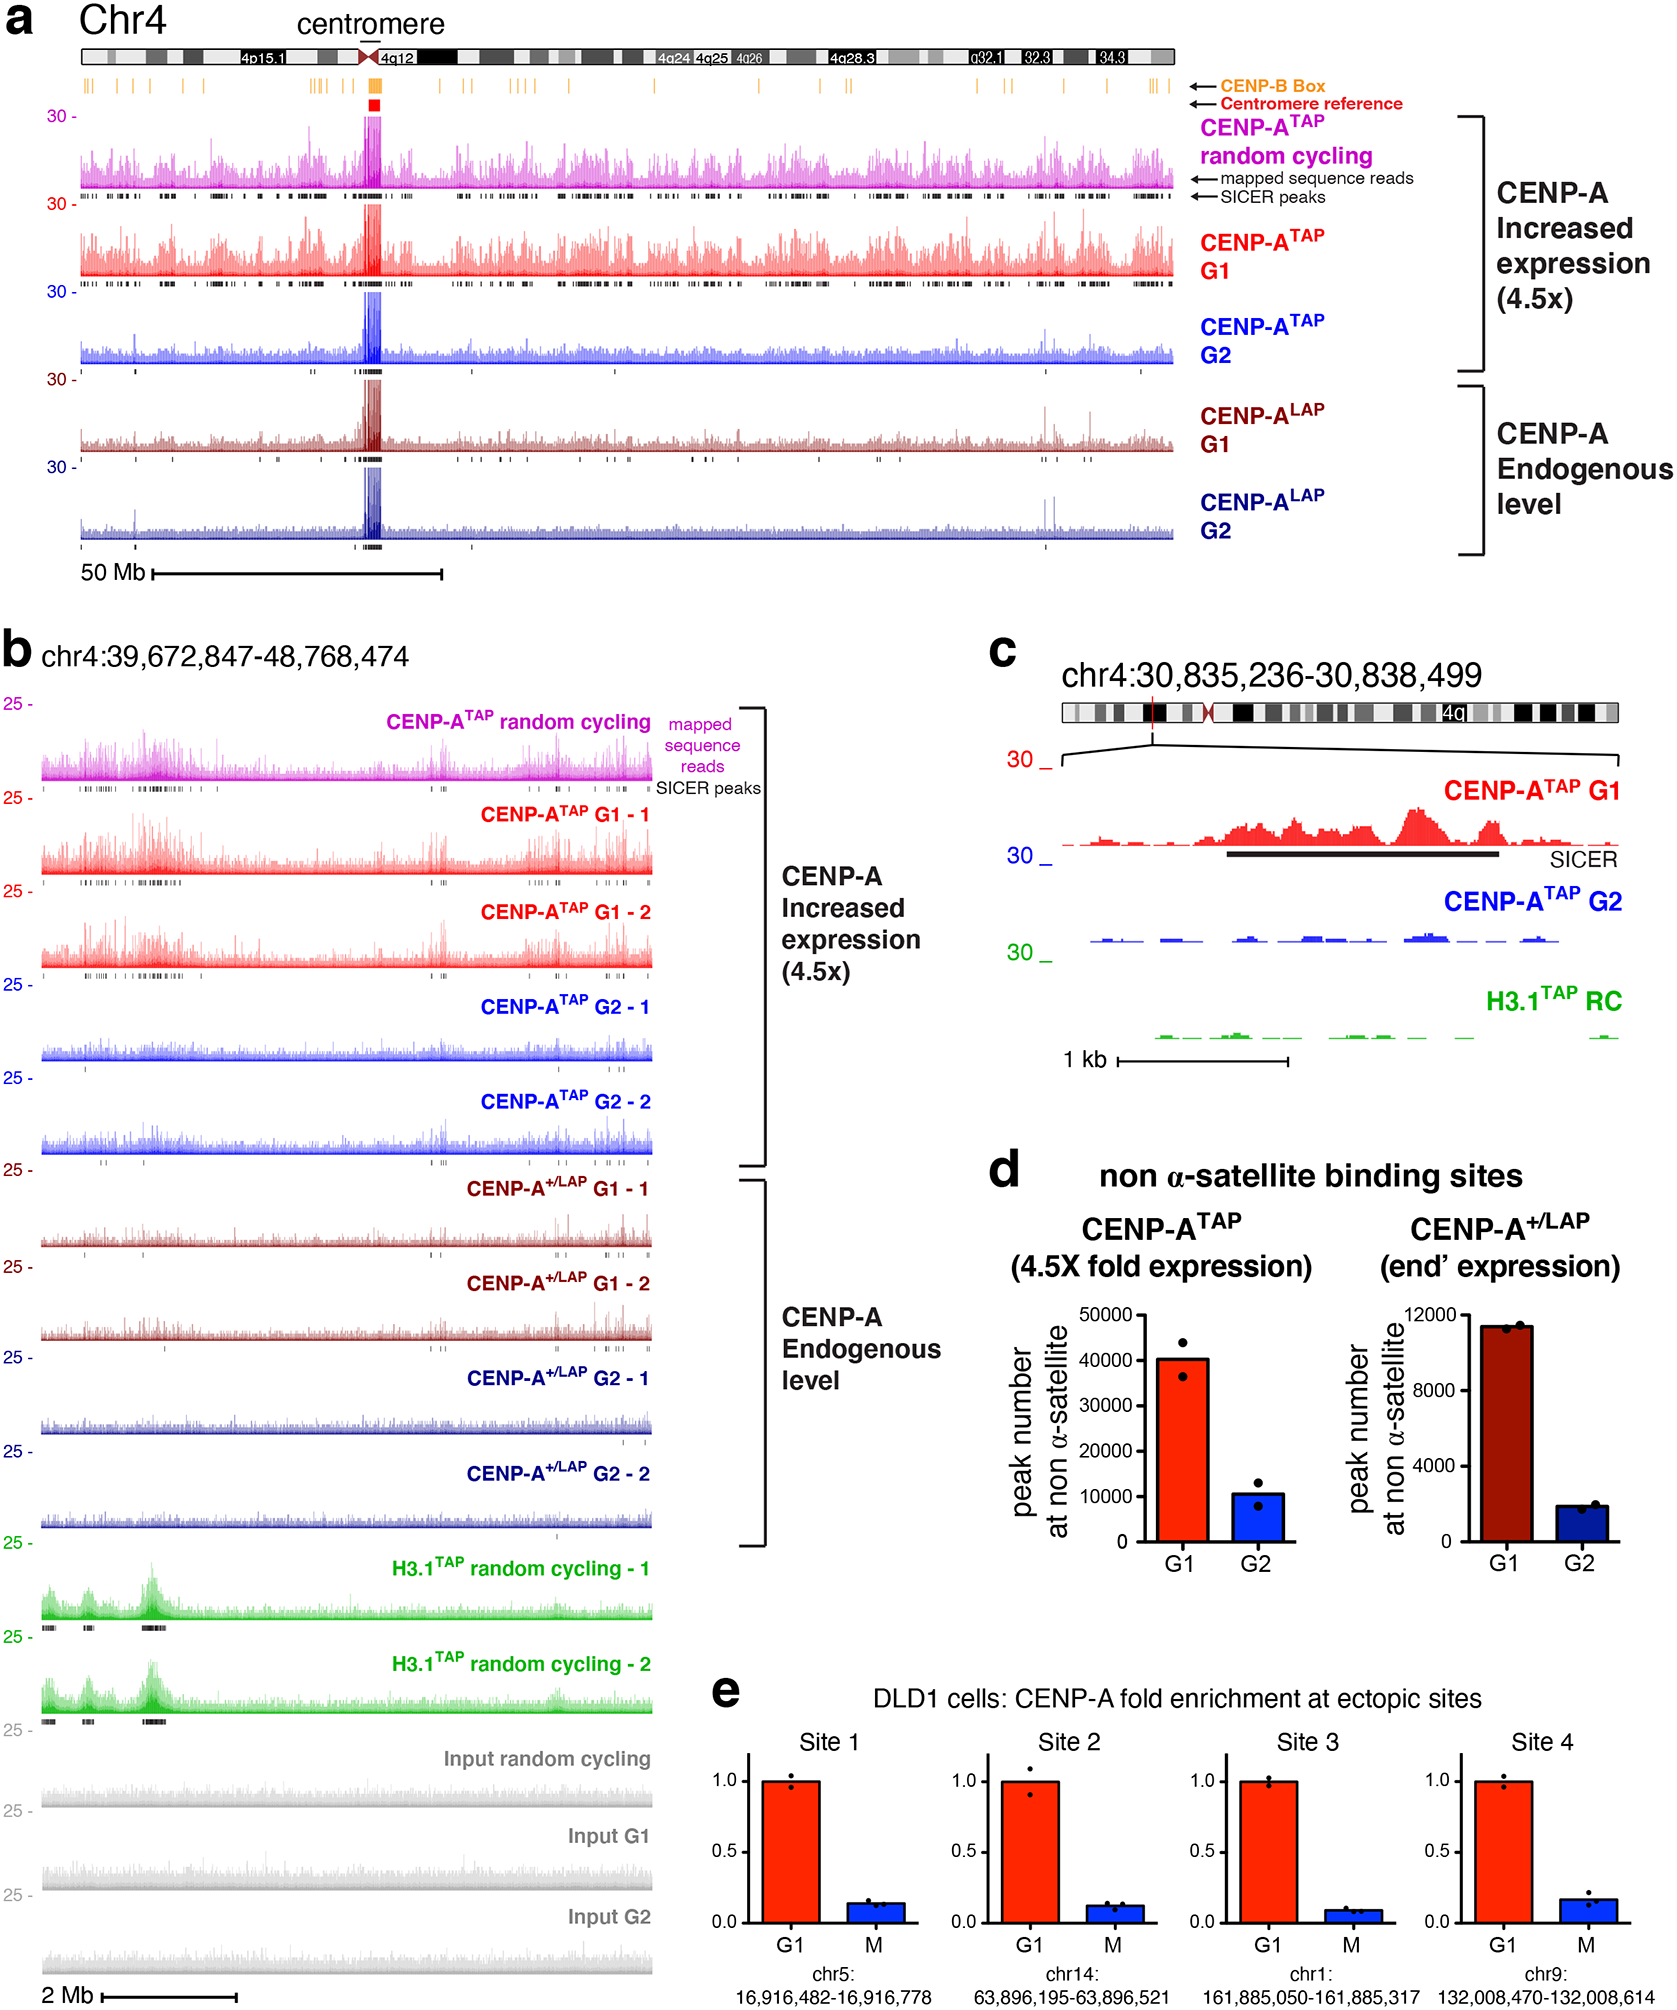
Figure 3. Sites of CENP-A assembly onto chromosome arms in early G1 are removed by G2.

(a) ChIP-sequencing raw mapping data (colored) and SICER peaks (black lines, underneath) showing sequences bound by CENP-A (at both endogenous and increased expression levels) across chromosome 4 before and after DNA replication. Centromere reference location, red. CENP-B box location, orange. Read counts were scale to 30 but reaches 150 at the centromere. Scale bar, 50Mb. (b) ChIP-sequencing data are shown for a region within the p-arm of chromosome 4, with two replicates for each time point, for CENP-ATAP (increased CENP-A expression), CENP-ALAP (endogenous level), and H3.1TAP. Scale bar, 2Mb. (c) High resolution nucleosomal view of CENP-ATAP mapping data at G1 and G2 at a non-centromeric site of chromosome 4. Scale bar, 1kb. The experiments in a-c were repeated independently twice with similar results. (d) Total number of non-α-satellite CENP-A binding sites for CENP-ATAP and CENP-ALAP at G1 and G2. The number represent the average of the two sequencing replicates per time point. (e) Quantitative real-time PCR following CENP-A ChIP from DLD1 cells with auxin degradable CENP-AAID and a doxycycline-inducible CENP-AWT 37 after synchronization in G1 or in mitosis (as shown in Supplementary Fig. 3b) for sites on the arms of chromosomes 1, 5, 9, and 14. Sites for qPCR were chosen based on identification of ectopic deposition of CENP-A at these locations in Hela cells. Levels of CENP-A enrichment at mitosis were normalized to the level of enrichment at G1. Resrults of two independent experiments for G1 and 3 for mitosis are shown. Source data for d and e can be found in Supplementary Table 4.
