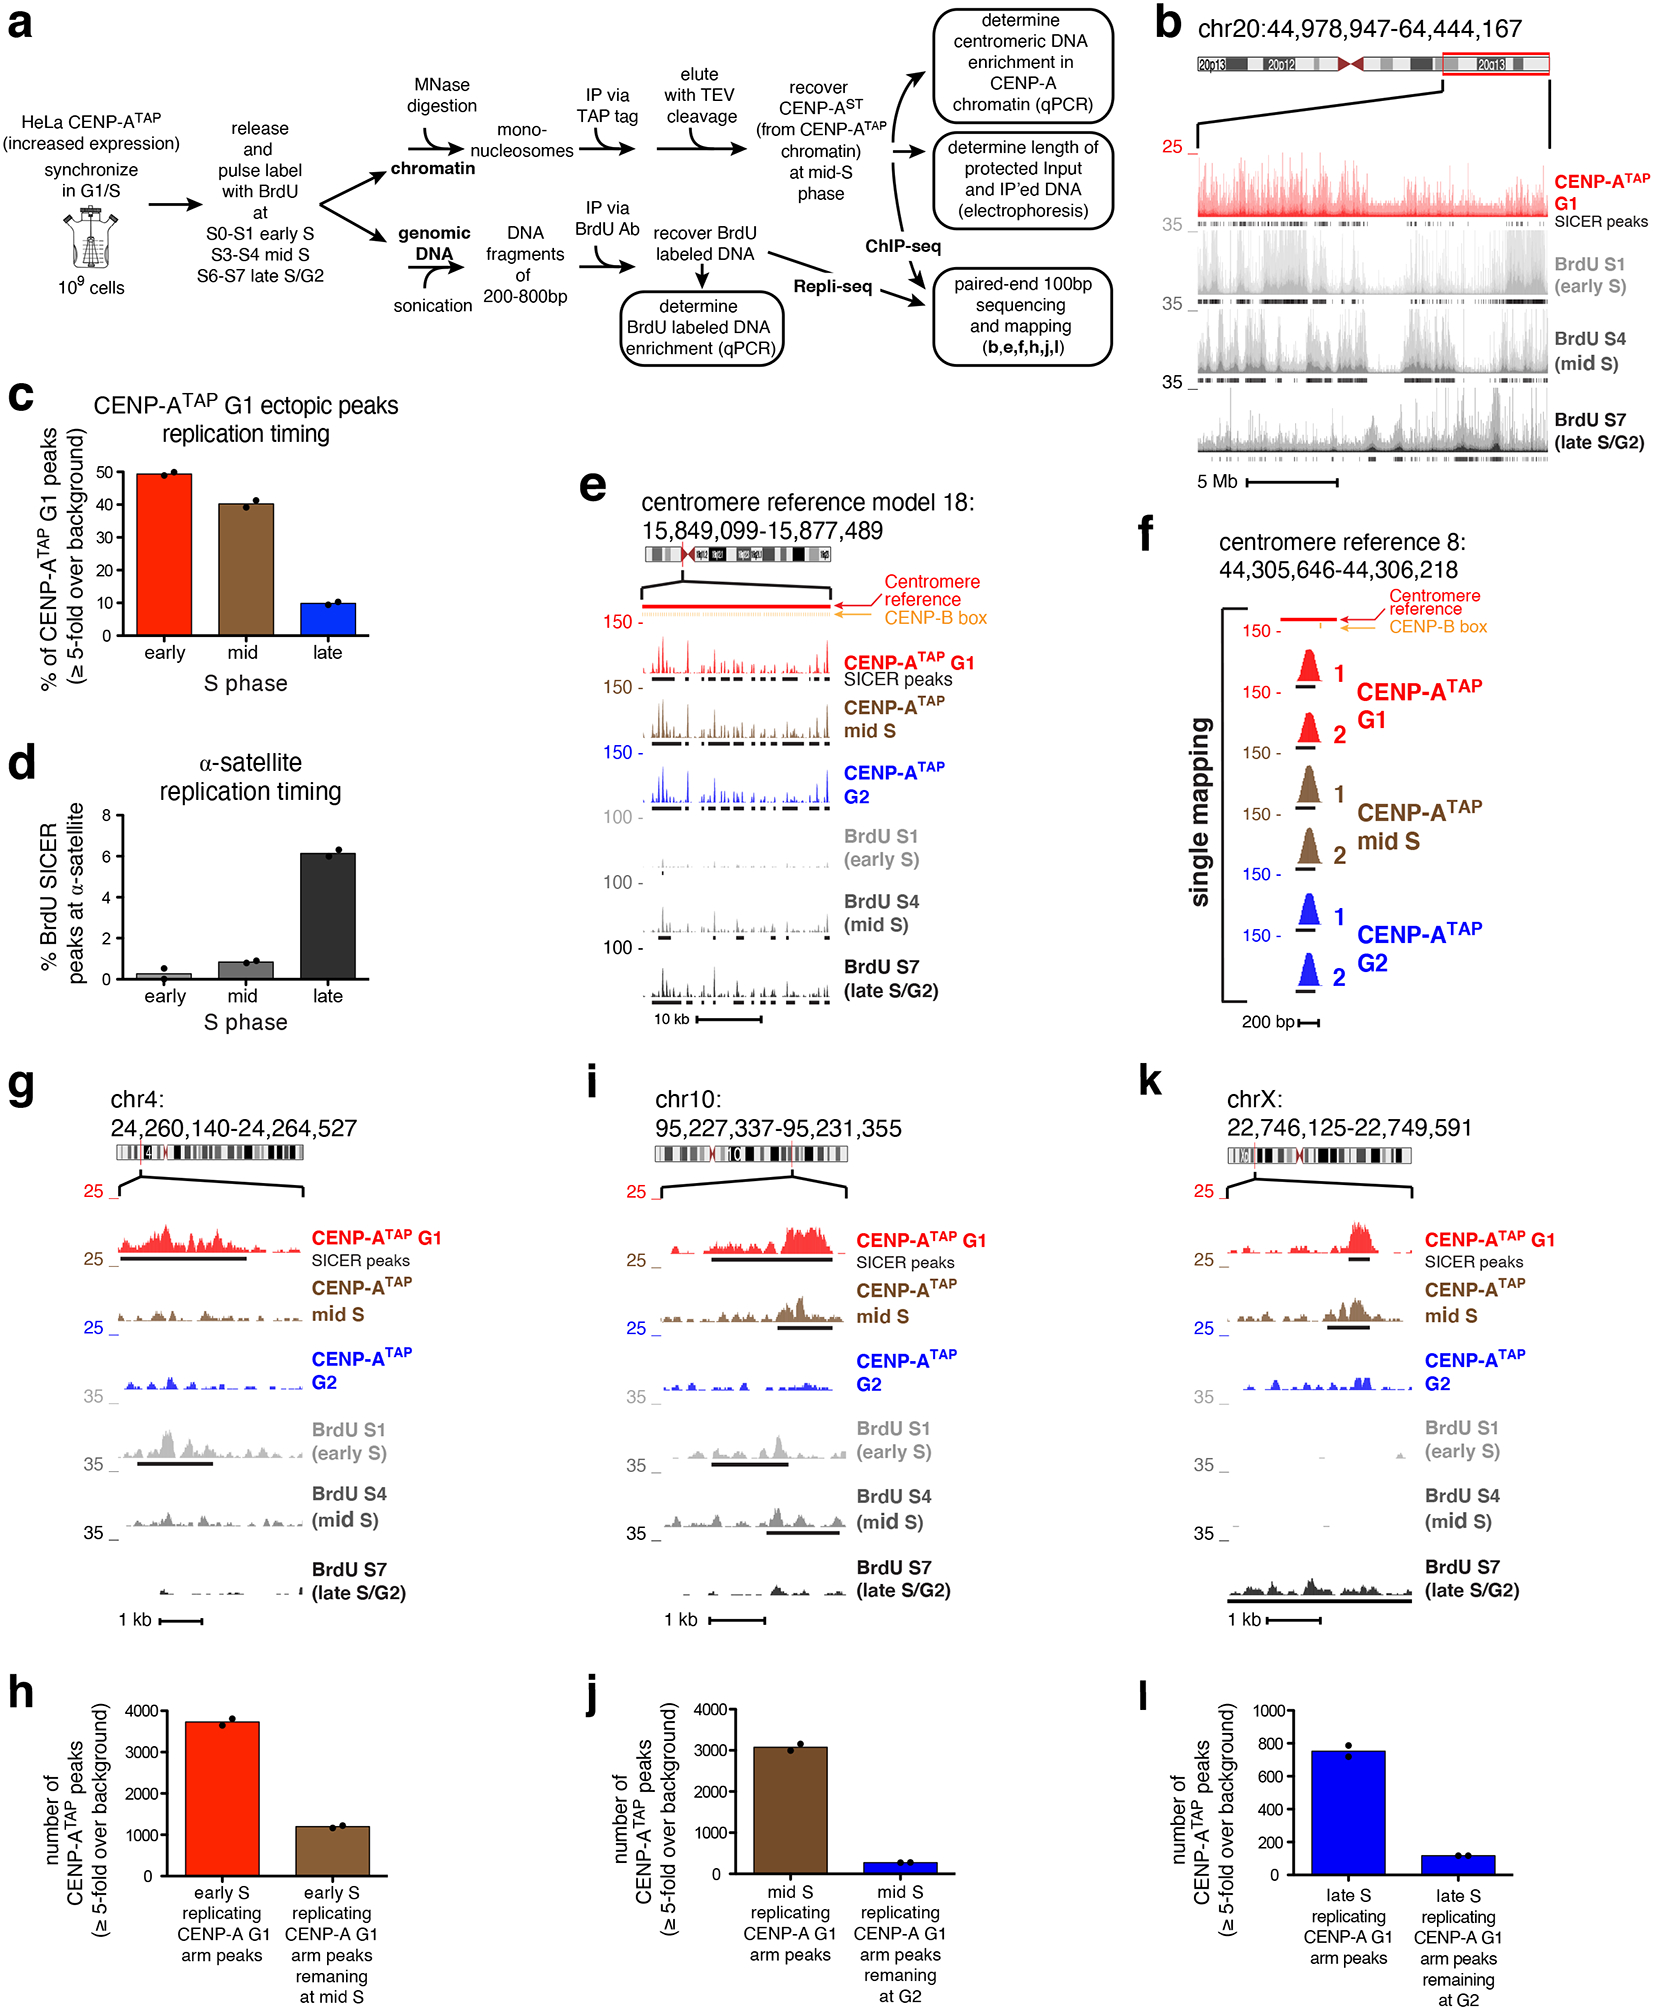
Figure 6. Ectopic CENP-A is removed contemporaneously with replication fork progression, while centromeric CENP-A is retained.

(a) Experimental design of CENP-A ChIP-seq combined with Repli-seq. (b) Raw mapping data of CENP-ATAP ChIP-seq at G1 (red) and BrdU repli-seq (grey scale) at early S, mid S and late S/G2 at q-arm of chromosome 20. SICER peaks, black lines underneath raw mapping data. Scale bar, 5 Mb. (c) Percentage of ectopic G1 CENP-ATAP ≥5-fold binding sites at early, mid, or late S replicating regions. (d) Percentage of BrdU SICER peaks at α-satellite DNA found within early, mid or late S replicating regions. (e) CENP-A ChIP-seq raw mapping data at cen18 at G1, mid S phase and G2, and BrdU repli-seq at early S, mid S and late S/G2. SICER peaks, black lines underneath the raw mapping data. Centromere reference location, red. CENP-B boxes, orange. Scale bar, 10kb. (f) High-resolution view of CENP-A mapping during DNA replication (mid-S) at a single copy variant (marked by a purple bar in Fig. 2a) in the centromere reference model of chromosome 8. Data from Figure 2c for CENP-ATAP G1 and G2 is included for comparison. Scale bar, 200bp. (g, i, k) Raw mapping data (colored) and SICER peaks (black lines, underneath) of CENP-ATAP ChIP-seq at G1, mid S phase and G2 and BrdU labeled repli-seq samples (grey scale) showing regions going through replication at early S, mid S and late S/G2 phase within the p-arm of chromosome 4 (g), the q-arm of chromosome 10 (i), and the p-arm of chromosome X. Scale bars, 1kb. (h) Number of early replicating CENP-ATAP G1 peaks (≥5-fold over background) retained at mid S phase. (j) Number of mid-S replicating CENP-ATAP G1 peaks (≥5-fold over background) retained at G2. (l) Number of late replicating CENP-ATAP G1 peaks (≥5-fold over background) retained at G2. Source data for c,d, h, j, and l can be found in Supplementary Table 4. Data shown in Fig 6b–l are from two biologically independent experiments.
