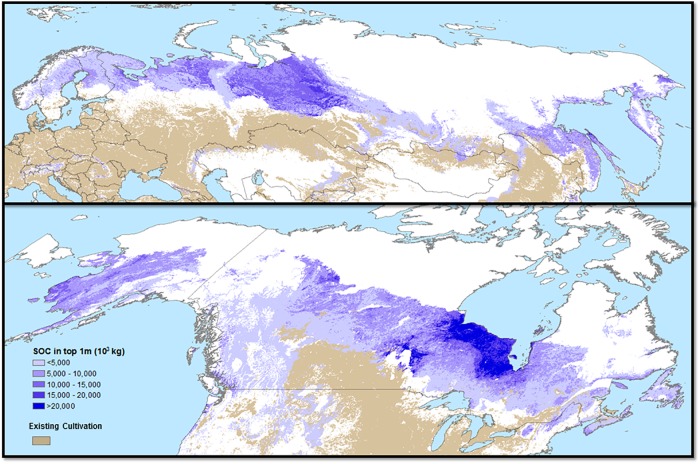
Fig 2. Soil organic carbon content in top 1 meter of soil (103 kg ha-1) in areas of climate-driven agricultural commodity frontiers using RCP8.5 2060–2080 climate projections (blue color ramp).
Areas with >50% GCM agreement commodity frontiers are shown. Existing agricultural land cover >10% of each pixel is represented in light brown.

