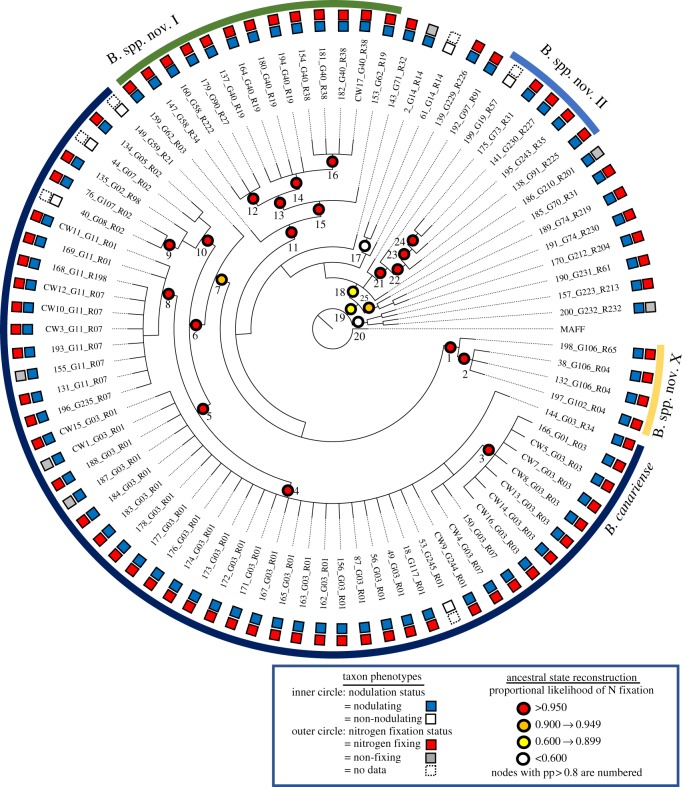
Figure 2.
Bayesian cladogram inferred with glnII and recA. Four previously identified species-like clades are indicated with the outermost curved bars [44]. Symbiotic phenotypes are indicated on the tips of the tree with concentric circles, the outer indicating nitrogen fixation (red squares, significant nitrogen fixation; grey, no significant nitrogen fixation; dotted square, no data) and the inner indicating nodulation. Numbers identify clades with Bayesian posterior probabilities ≥0.80 (i.e. pp, Bayesian support value). Ancestral states for nitrogen fixation are estimated for all well-supported internal nodes using maximum likelihood. Proportional likelihood of the nitrogen fixation is reported via the colour of the node labels. In the parsimony analysis, all 20 well-supported ancestral nodes were inferred to be nitrogen fixing except for no. 17, which was ambiguous (electronic supplementary material, table S3). (Online version in colour.)

