Figure 2.
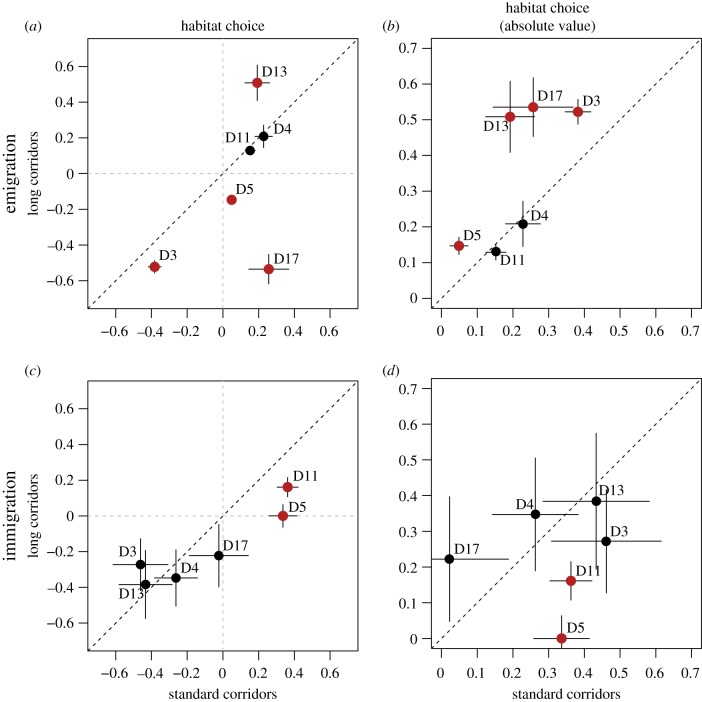
Fragmentation affects habitat choice at emigration (a,b) and immigration (c,d). Estimates ± s.e. of habitat choice under long corridors (y-axis) versus standard corridors (x-axis) are shown. Each dot represents one genotype, and s.e. of estimated habitat choice values are illustrated by error bars (table 1). Habitat choice estimates (a & c) vary between −1 and 1: h = 0 for random dispersal (illustrated by grey dashed lines), h > 0 for a preference for optimal habitats and h < 0 for a preference for suboptimal habitats. The black dashed line illustrates the null hypothesis where fragmentation does not affect habitat choice. In addition to basic habitat choice estimates, absolute habitat choice values are provided to illustrate habitat choice ability irrespective of its adaptive value (b,d): dots below the line correspond to a decrease in habitat choice with fragmentation, while genotypes increasing habitat choice with fragmentation are above the line. Red dots are genotypes significantly affected by fragmentation (table 1). (Online version in colour.)

