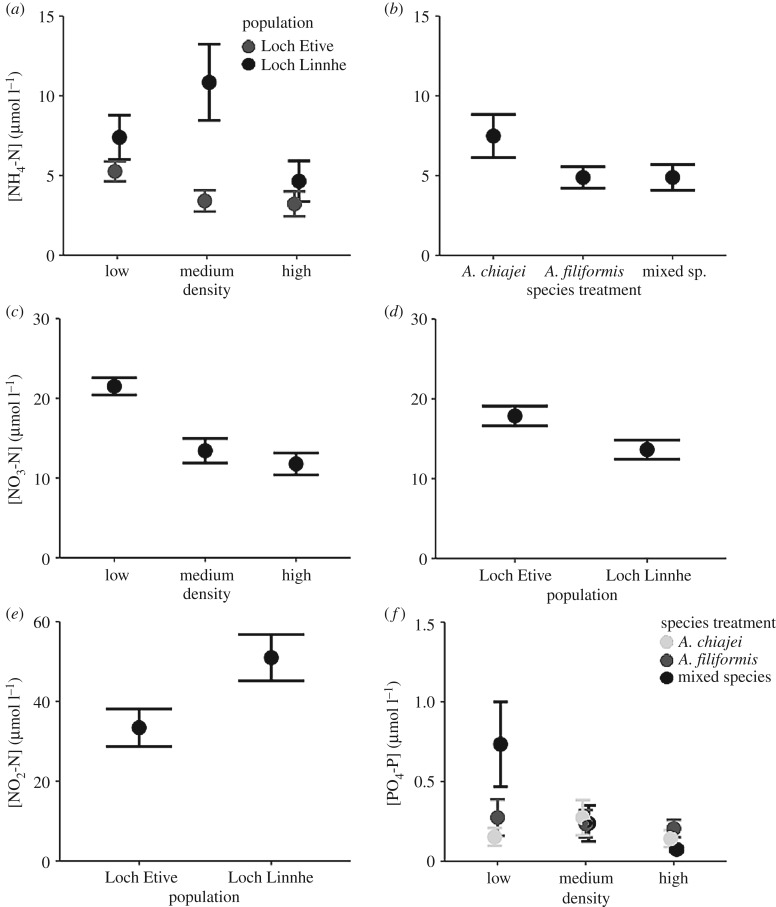
Figure 3.
The effects of differing biotic and abiotic context on (mean ± s.e., n = 6) (µmol l−1) (a,b) [NH4-N], (c,d) [NO3-N], (e) [NO2-N] and (f) [PO4-P] where (a) shows the interactive effects of density × population, (b) shows the independent effect of species treatment, (c,d) show the independent effects of density and population, respectively, (e) shows the independent effect of population and (f) the interactive effect of density × species treatment.

