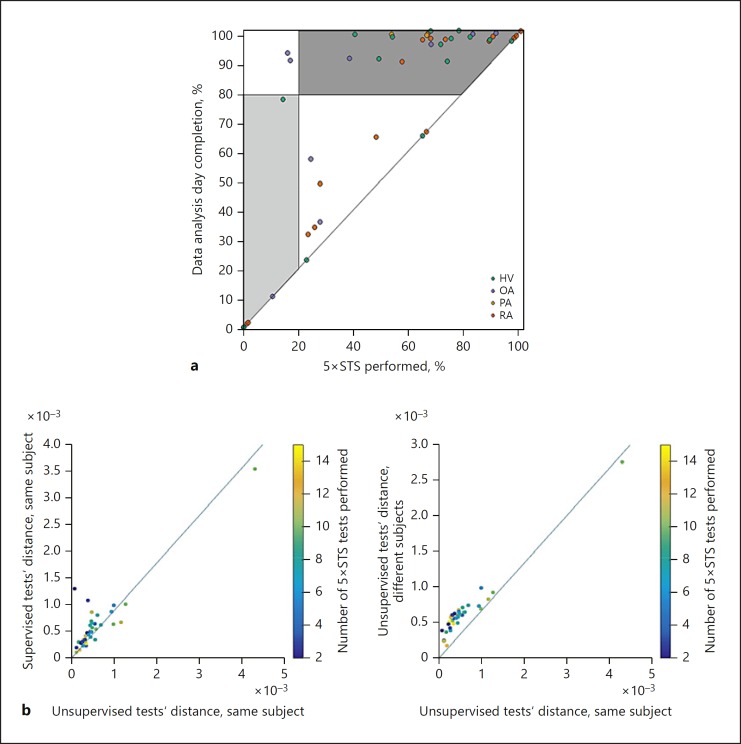
Fig. 2.
a Study completion percentage against percentage of Five Times Sit to Stand (5×STS) tests performed. Light grey area: low adherence (participated in performing the tests for less than 80% of the time, completed less than 20% of the tests). Dark grey area: high adherence (participated in performing the tests for more than 80% of the time, completed more than 20% of the tests). There were more participants with high adherence (top right corner) than participants with low adherence (bottom left corner). Moreover, we observed a group of participants whose adherence was around 50%, but they took their tests until the end of the study (top centre side). The latter possibly were participants who forgot to take some tests. HV, healthy volunteers; OA, osteoarthritis; PA, psoriatic arthritis; RA, rheumatoid arthritis. b Comparison of different 5×STS tests. Each point identifies the maximum distance, measured with dynamic time warping (DTW) [21], between two tests that are selected according to a specific criterion, which varies with the axes. On the left plot, the x axis characterizes supervised tests, while the y axis characterizes supervised tests performed by the same participant. On the right plot, the x axis characterizes tests performed by the same participant, while the y axis characterizes tests performed by different participants. The presence of a supervisor did not impact consistency (left). In contrast, different participants performed the 5×STS tests differently (right).

