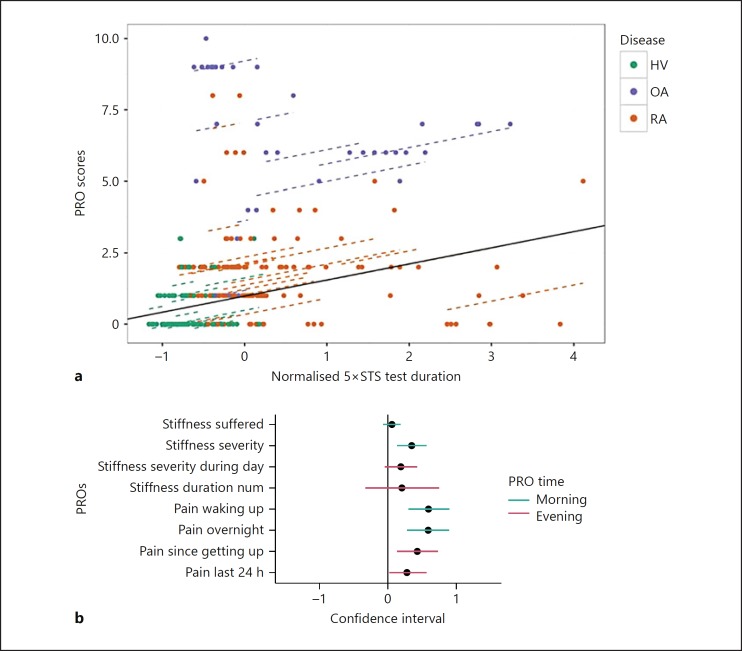
Fig. 3.
a Prediction model of the pain waking up reported by the participants (patient-reported outcome [PRO]) as a function of Five Times Sit to Stand (5×STS) test duration through a mixed-effects model. The solid line represents the global model, i.e., the estimates obtained over the subset of fixed-effects components that are part of the mixed-effects model. The dashed lines are obtained by adding the individual intercept to the global model. Some of the individual lines differ noticeably from the global line, which motivates our choice of an individual intercept. HV, healthy volunteers; OA, osteoarthritis; RA, rheumatoid arthritis. b Forest plot measuring the relationship strength between 5×STS test duration and the pain/stiffness reported by the participants. Dots and horizontal lines show the correlation value ± 2 times the standard error. The vertical black line indicates a coefficient of zero. A high correlation between 5×STS test duration and pain severity was demonstrated. The relationship to pain severity on waking up was strongest and highly significant. Among stiffness-related PROs, the strongest relationship was to stiffness severity rated in the morning.

