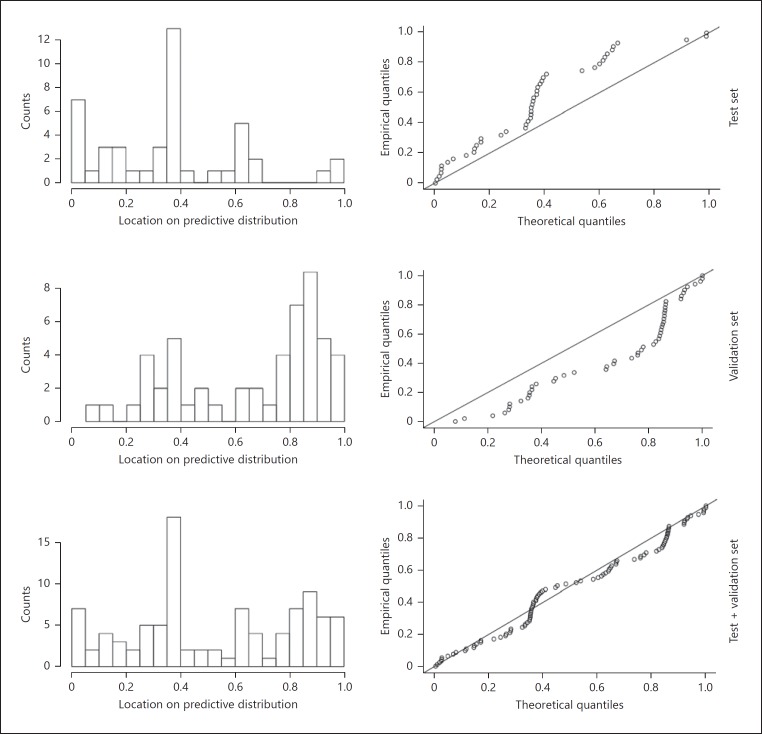
Fig. 4.
Prediction discrepancy plots for the predictions of pain waking up, obtained from a mixed-effects model. This was fitted on the duration of the Five Times Sit to Stand exercise, along with two covariates: gender and disease type. The graphs on the left show the histograms of the empirical cumulative distribution function (CDF) against the predicted CDF, while the graphs on the right show the predicted CDF as a function of the empirical CDF. The distribution of residuals from the fit is unbiased, although the frequency of very high and very low residuals was higher than expected.

