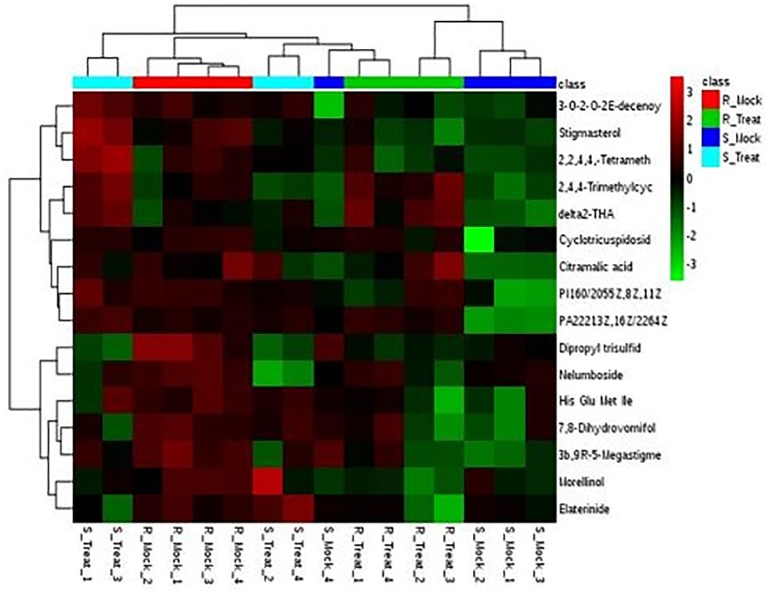
Fig 8. Hierarchial clustering showing heat map of RRC metabolites with fold change > 1 in the Mock treatments (R_Mock vs. S_Mock) and their response in other treatments generated using Metaboanalyst software.
Red and green colors represent up and down regulation, respectively. Columns are exhibiting samples and rows are exhibiting metabolites here.

