
Fig 9. Hierarchial clustering showing heat map of top 60 RRI metabolites of resistant and susceptible varieties, induced by the infection of A. tubingensis, generated using Metaboanalyst software.
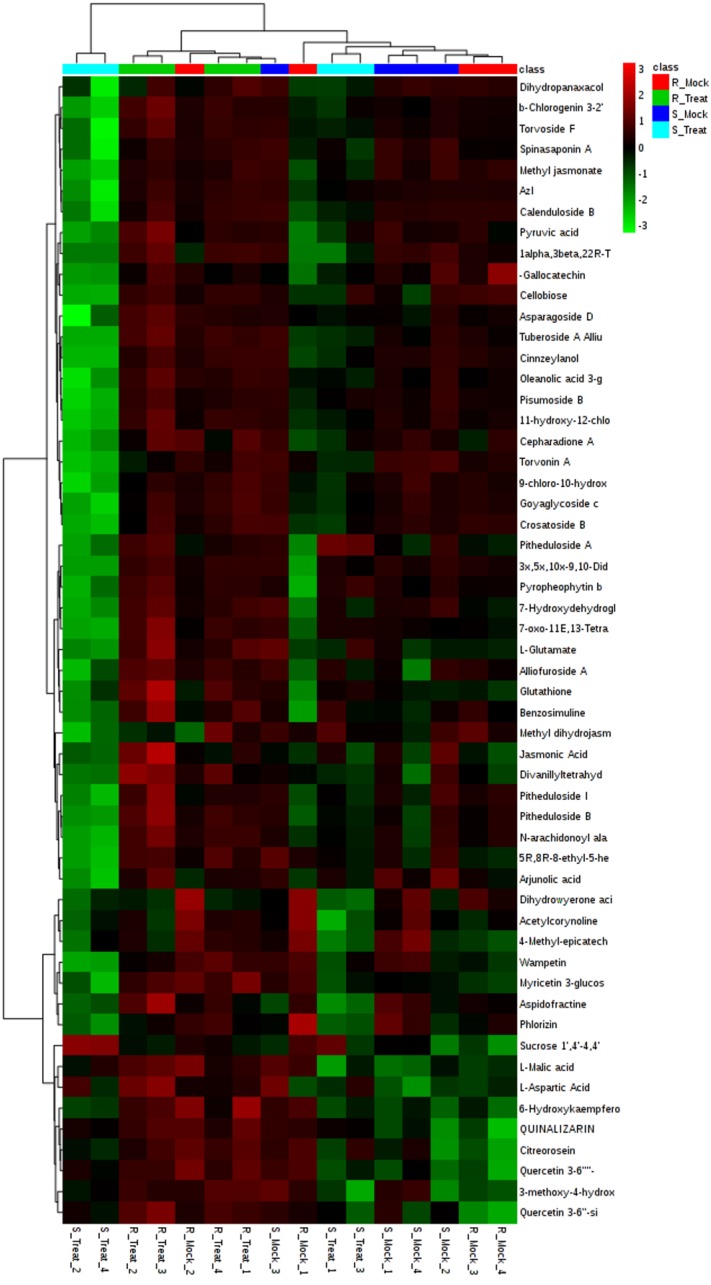
Red and green colors represent up and down regulation, respectively. Columns are presenting samples and rows are exhibiting metabolites here. Clustering is evident from the shown dendrograms.