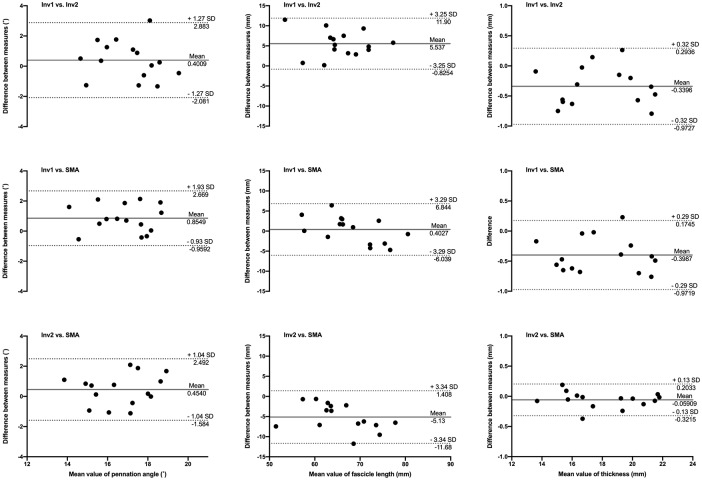
Fig 4. Bland-Altman plots of pennation angle, fascicle length and muscle thickness obtained from scans of the gastrocnemius medialis in Sample A.
Comparisons between automated analysis (SMA), manual analyses from investigator 1 (Inv1) and investigator 2 (Inv2) are illustrated by differences between pairs of measurements as a function of the mean measurements. Solid and dotted lines depict bias and 95% limits of agreement, respectively.

