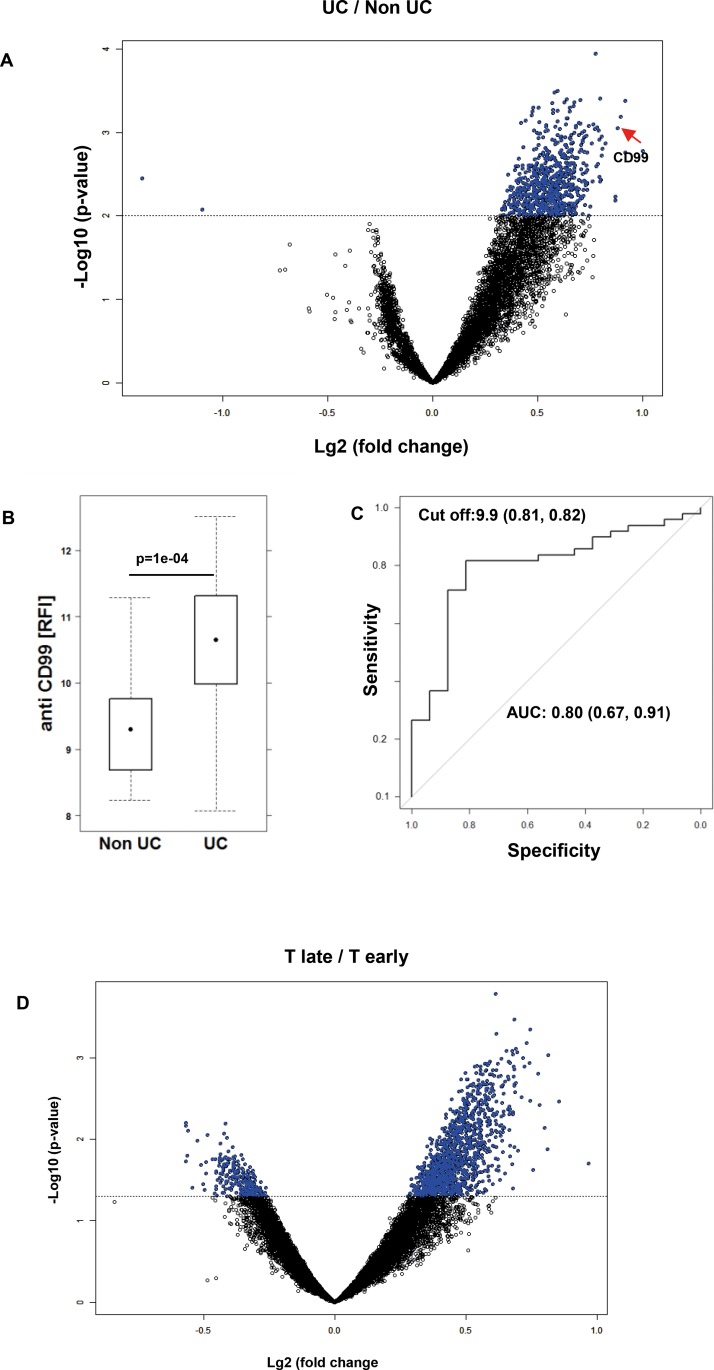
Fig 1. Autoantibodies as biomarkers to discriminate between UC and non-UC donors.
(A) Increased autoantibody reactivity in UC patients displayed as a volcano plot. Purified serum IgG of UC (49) and non-UC (23) patients were subjected to protein-microarray analysis of UC vs non-UC. Antigenic reactivity in UC versus non-UC is presented. Significantly differentially reactive antigens are given in blue (n = 697; p<0.01; x-axis: “-log10 p value”; y-axis shows the log2 –fold change between classes-). (B) Expression levels of anti-CD99 antibodies in UC (n = 49) and non-UC (n = 23) donors depicted as a boxplot diagram. RFI, Log2 of median relative fluorescent intensity. Boxes represent upper and lower quartiles and whiskers represent variability. For comparison of non-UC versus UC, a Student’s t-test was performed. (C) ROC curve for anti-CD99 antibodies in differentiating UC and Non-UC patients. Sample sizes: non-UC n = 19, UC n = 49. AUC: Area under the curve; Cut of value indicates the optimal ratios of sensitivity and specificity. (D) Increased autoantibody reactivity in donors prior to diagnosis with UC presented as volcano plot. IgG (purified from plasma) from 9 different donors at two different time points (T-late: median 6 months prior to diagnosis; T-early: median 13 months prior to T-late) were examined. Antigenic reactivity in T-early versus T-late is presented. Significantly differentially reactive antigens are given in blue (n = 1201; p<0.01; x-axis: “-log10 p value”; y-axis shows the log2 –fold change between classes.

