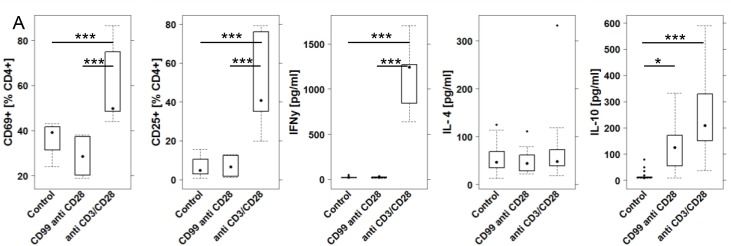
Fig 3. CD99 elicits an anti-inflammatory response in vitro.
1x10⁶ PBMC were incubated for 48h in 1.5 mL RPMI and subjected to flow cytometric analysis and supernatants to a multiplex Luminex assay. (A) Cells were incubated in the presence or absence of CD99 (10 μg / mL) and anti CD28 antibodies (5g /mL). Anti CD28 and anti CD3 antibodies (5 μg and 1μg/ mL, respectively) served as a positive control. Frequencies of activated CD4+ T cells and levels of IFNγ, IL-4 and IL-10 depicted as boxplot diagrams. Sample sizes: Donors n = 3 (Non-UC n = 1, UC n = 2). Control n = 6, CD99 n = 3. Boxes represent upper and lower quartiles, whiskers represent variability and outliers are plotted as individual points. For comparison of groups, ANOVA followed by Tukey’s HSD was conducted. Labels given on x-axes on the bottom row apply to all charts.

