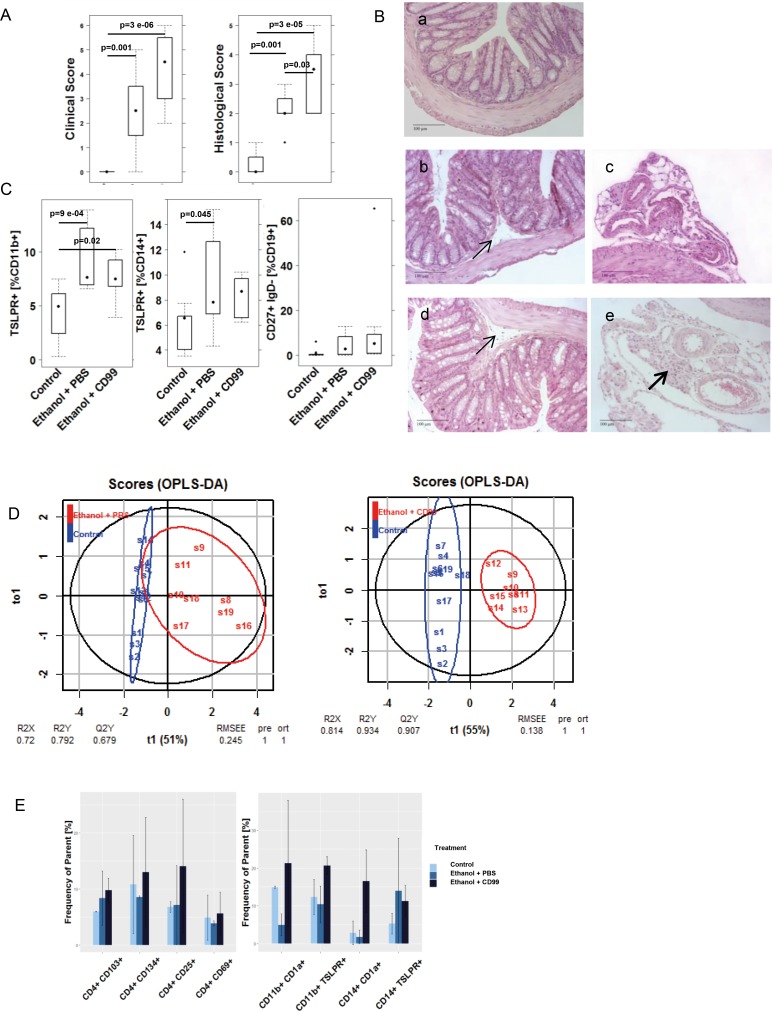
Fig 4. Additional challenge with CD99 aggravates the pathological phenotype of UC in NSG mice reconstituted with PBMC derived from patients with UC.
(A) Clinical activity score and histological score of distal parts of the colon depicted as boxplot diagrams. NSG mice were reconstituted with PBMC from two different UC patients exhibiting autoantibodies against CD99. Mice were challenged with 10% ethanol on day 8, 30% ethanol on day 15 and 18 and additionally challenged with 10 μg of CD99 in PBS on day 8, 15 and 18. Sample sizes: Control n = 8; challenged control (Ethanol + PBS) n = 8; additionally challenged (ethanol + CD99) n = 8. (B) Photomicrographs of stained H&E paraffin sections from distal parts of the colon of NSG mice that had been treated as in A. (a) Unchallenged control, (b, c) challenged control (ethanol + PBS), (d, e) additionally challenged with CD99 (ethanol + CD99). Arrows indicate edema and influx of immune cells into the submucosa, bold arrows influx of inflammatory cells into the mesentery. (C) Frequency of human leucocytes isolated from spleen of NSG-UC mice and analyzed by flow cytometric analysis depicted as boxplot diagrams. (D) oPLS-DA analysis of control versus the ethanol + PBS and control versus ethanol + CD99 using the following parameters: Clinical score, colon score, histological score, frequencies of TSLPR expressing CD11b+ and CD14+ cells and switched B cells. (E) Frequencies of human leucocytes isolated from colons of mice that had been treated as described in A. Samples from each group were pooled for flow cytometric analysis. Mean values are given; error bars are s.d. Sample sizes: donors with anti-CD99 antibodies n = 2. Control n = 2; challenged control (Ethanol + PBS) control n = 2, additionally challenged (ethanol + CD99) n = 2.

