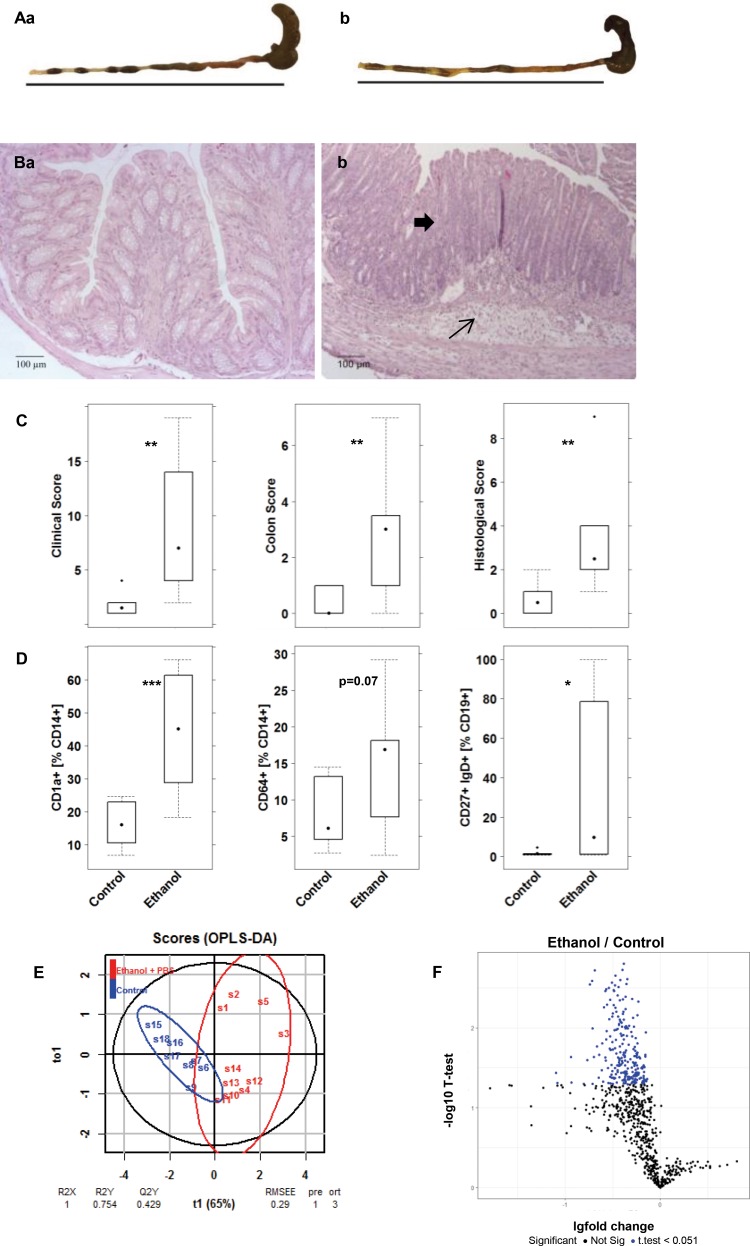
Fig 6. Decrease of autoantibody levels in highly inflammatory NSG mice.
Mice were reconstituted with PBMC derived from two different UC patients, challenged with 10% ethanol at day 8, and 50% ethanol at days 15 and 18. (A) Macrophotographs of colons at autopsy. (B) Photomicrographs of H&E-stained sections of distal parts of the colon from mice. Arrows indicate edema and influx of inflammatory cells, bold arrows crypt loss. (C) Clinical-, colon- and histological scores of NSG-UC depicted as boxplot diagrams. (D) Frequency of human leucocytes isolated from spleen of NSG-UC mice and analyzed by flow cytometric analysis depicted as boxplot diagrams. Sample sizes: Control (n = 8); Ethanol + PBS (n = 10), Labels given on x-axes on the bottom row apply to all charts. Boxes represent upper and lower quartiles, whiskers represent variability and outliers are plotted as individual points. For comparison of groups, ANOVA followed by Tukey’s HSD was conducted. (E) oPLS discriminating analysis combining clinical-, colon, histological scores, frequencies of CD14+CD64+, CD11+ CD1a+, CD19+CD27+IgD+. (F) Expression levels of autoantibodies in sera of mice depicted as volcano plots. Mouse sera were subjected to protein microarray analysis using the targeted array presenting 192 proteins as described in Material and Methods. Student T-test was used to discriminate between groups, the threshold for significance was p = 0.05 and significant changes are depicted in blue.

