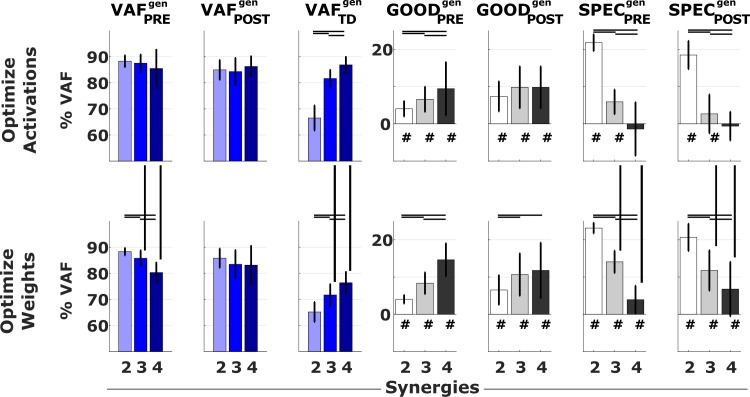
Fig 5. VAF when using the generic synergies.
Results from the EMG reconstructions using generic synergies. Colored bars report mean and standard deviation of the VAF values in the PRE, POST and TD conditions. Grey bars report the differences GOODPREgen = VAFPRE−VAFPREgen, GOODPOSTgen = VAFPRE−VAFPOSTgen, SPECPREgen = VAFPREgen–VAFTDgen and SPECPOSTgen = VAFPOSTgen–VAFTDgen. Black lines indicate significant differences (p<0.05). The symbol # indicates values of GOOD and SPEC that are significantly (p<0.05) greater than zero.

