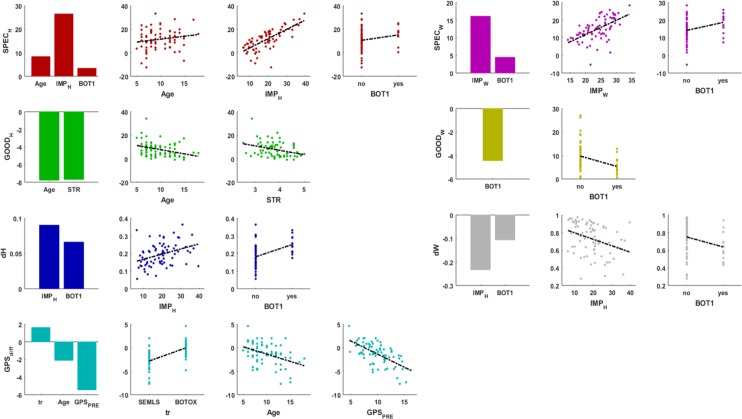
Fig 7. Results from the stepwise regression analysis.
Results are reported for each of the dependent variables. The bar graphs report the effect sizes of the statistically significant independent variables of the fitted models. In the scatter plots the dependent variables are plotted as a function of each of the independent variables included in the model. SPEC specificity (%); GOOD goodness (%); IMP impairment of the subject pre-treatment (%); Age at time of surgery (years); STR average pre-treatment strength report; dW change in synergy weights expressed as the correlation coefficient between pre- and post-treatment; dH change in synergy activation profiles expressed as RMSE between pre- and post-treatment; GPSPRE gait profile score pre-treatment (degrees); GPSdiff difference between GPSPRE and GPSPOST (degrees); BOT1 rectus femoris injection (yes/no); tr treatment (BOTOX/SEMLS). Subscripts W and H indicate that the signal reconstruction was performed optimizing the weights or the activation profiles, respectively.

