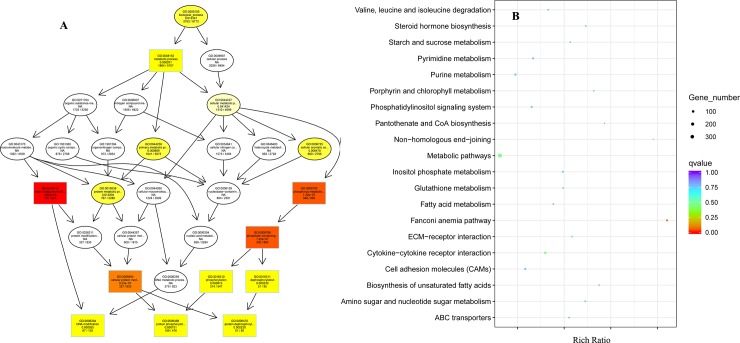
Fig 2. The functional enrichment graphics for genes covering at least one JJ-specific non-synonymous SNP.
(A) Directed acyclic graph of GO enrichment analysis. Colors from light to dark represent significant levels from weak to strong, respectively. (B) The significant enrichment graphics of q-values using the 20 most significant pathways.

