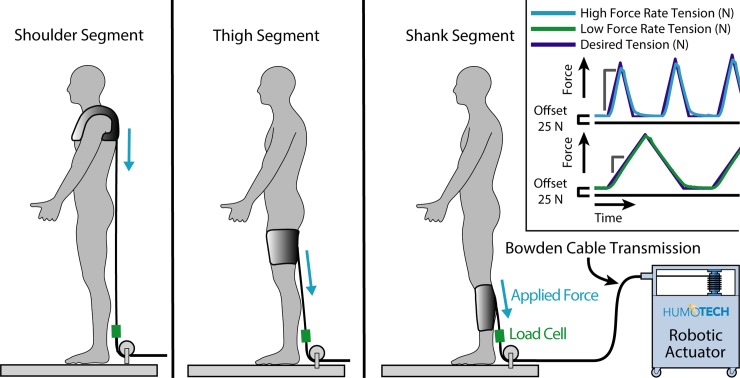
Fig 1. Experimental setup.
A robotic actuator was used to apply pulling forces to three separate interface locations. The subject stabilized themselves in a custom scaffold (not depicted for clarity; see Appendix). Inset: Desired tension force (blue) vs. actual tension force (green). The peak force of the triangle profile increased incrementally by 50 N from the beginning value. The triangle wave force profile was determined by the specified loading rate. The initial peak force value (peak value of the first triangle) and the rate of force application (high vs. low) were randomized for each segment, subject and session. For the shoulders, the high force rate was 300 Ns-1 and the low force rate was 100 Ns-1; for the shank and thigh, the high force rate was 3000 Ns-1 and the low force rate was 1000 Ns-1.

