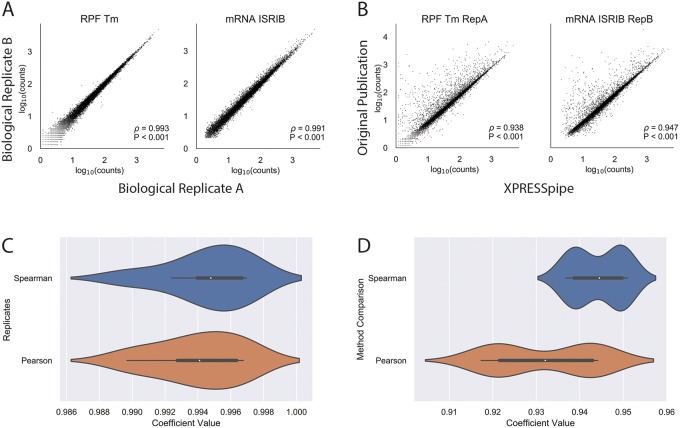
Fig 2. Representative comparisons between processed data produced by XPRESSpipe and original study.
Genes were eliminated from analysis if any RNA-Seq sample for that gene had fewer than 10 counts. A) Representative comparisons of biological replicate read counts processed by XPRESSpipe. B) Representative comparisons of read counts per gene between count data from the original study and the same raw data processed and quantified by XPRESSpipe. C) Boxplot summaries of Spearman ρ and Pearson r values for biological replicate comparisons. D) Boxplot summaries of Spearman ρ and Pearson r values for between method processing. RPF, ribosome-protected fragments. Tm, tunicamycin. All ρ values reported in A and B are Spearman correlation coefficients using RPM-normalized count data. Pearson correlation coefficients were calculated using log10(rpm(counts) + 1) transformed data. XPRESSpipe-processed read alignments were quantified to Homo sapiens build CRCh38v98 using a protein-coding-only, truncated GTF.

