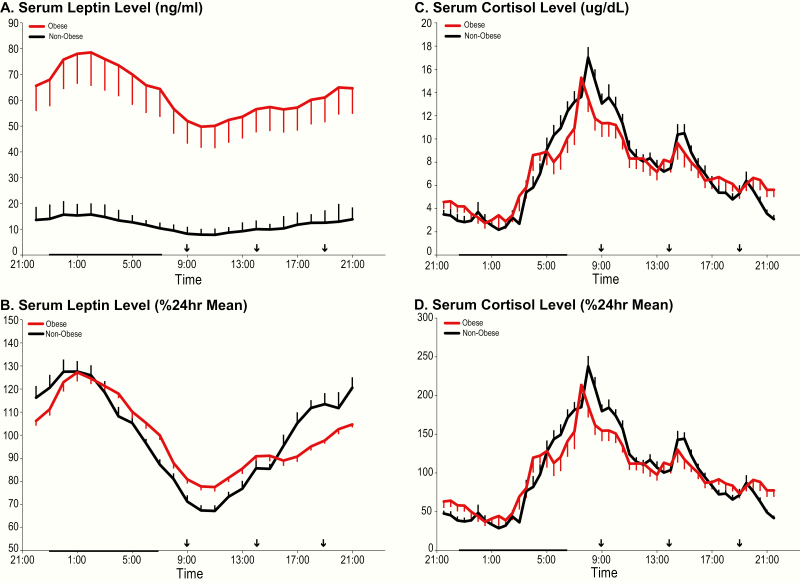
Figure 3.
Left panels: Mean 24-hour profiles of serum leptin levels in ng/mL (A) and expressed as % of the 24-hour mean (B) in obese (red lines) and nonobese (black lines) participants. Right panels: Mean 24-hour profiles of plasma cortisol in µg/dl (C) and expressed as % of the 24-hour mean (D) in obese (red lines) and nonobese (black lines) participants. In all panels, the standard error of the mean (SEM) is represented as a vertical bar at each time point, the black vertical arrows denote the identical carbohydrate-rich meals given at 0900, 1400, and 1900, and the black bar represents the approximate time in bed.

