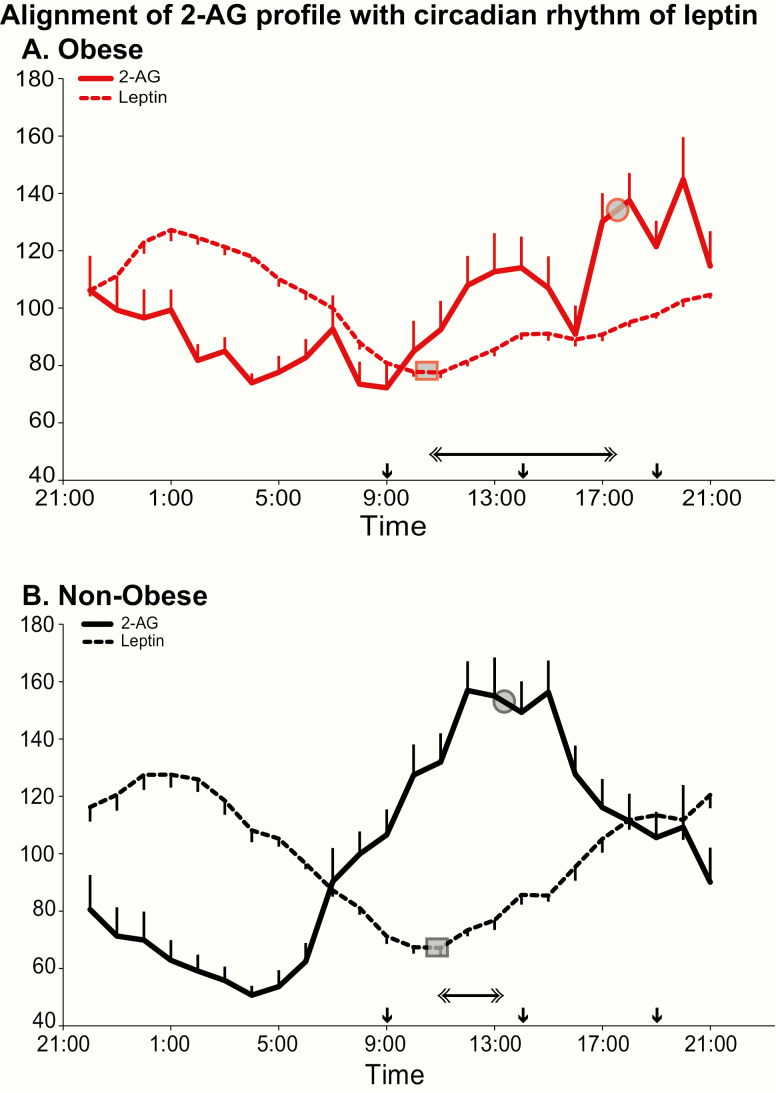
Figure 5.
Alignment of the 24-hour profile of serum 2-AG (solid lines) with the 24-hour peripheral rhythm of leptin (dashed lines) in obese (panel A; red lines) and nonobese (panel B; black lines) participants. For each profile, all data are shown as % of the individual 24-hour mean and the closed circle represents the mean timing of the acrophase (phase reference point for 2-AG) or the nadir (phase reference point for leptin) in the corresponding group of participants. The grey squares on each profile denote the time of the nadir and grey circles the acrophase. The horizontal double-sided arrow denote the time interval separating the phase reference point for 2-AG from the phase reference point in obese (top panel) versus nonobese (lower panel) participants. In all panels, the standard error of the mean (SEM) is represented as a vertical bar at each time point and the black vertical arrows denote the identical carbohydrate-rich meals given at 0900, 1400, and 1900.

