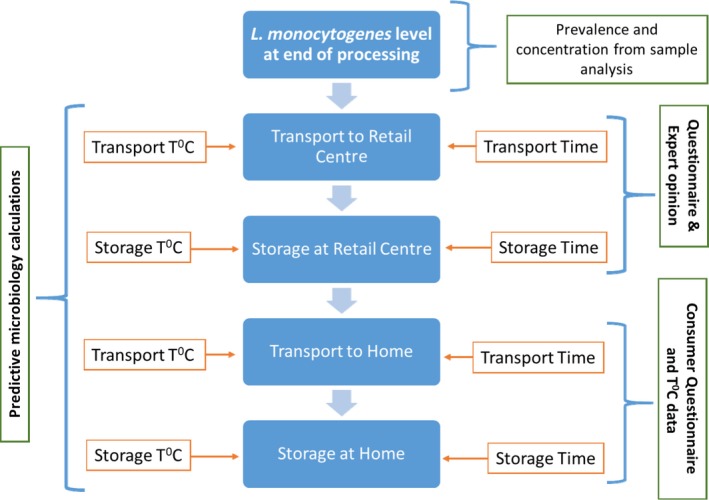
Figure 2.

Influence Diagram of the overall structure of the exposure assessment part of the model. The various stages between production and consumption are discretely modelled and the output of each stage is influenced by model inputs as depicted by the arrow points
