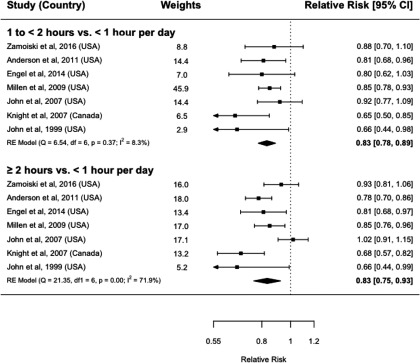
Figure 3.
Forest plot and random effects pooled relative risk of breast cancer comparing women that spend less than an hour in the sun per day during summer months to women that spend 1 to and during lifetime or usual adulthood. The black squares represent the effect estimates for each study and the whiskers represent the 95% CIs around these estimates for each study. The black diamond represents the summary effect estimate around 95% CI, with the center being the estimate and the ends being the confidence intervals. The vertical line represents a relative risk of 1. Note: CI, confidence interval; RE, random effects.

