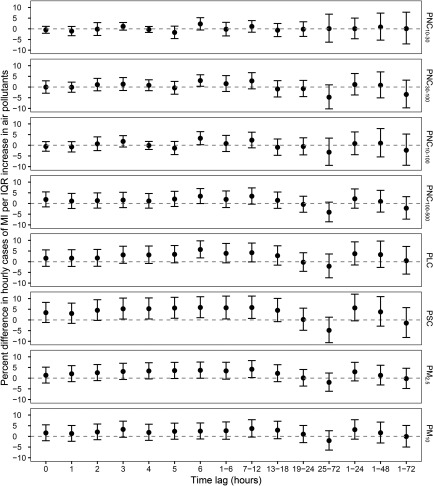
Figure 1.
Percent difference (95% CI) in hourly cases of myocardial infarction (MI) per interquartile range (IQR) increase in particle metrics in Augsburg, Germany from 2005 to 2015. A time-stratified case-crossover design with a conditional logistic model was used to derive the estimates while adjusting for natural splines of air temperature and relative humidity at lag 1–72 h (each with 4 degrees of freedom). Short-term associations were estimated at single-hour lags (lag0–lag6) and for moving averages (lag1–6, lag7–12, lag13–18, lag19–24, lag25–72, lag1–24, lag1–48, and lag1–72). Corresponding numeric data are provided in Table S1. For PSC, measurements during 1 January 2005–30 April 2012 were used. Note: PLC, particle length concentration; , particulate matter with an aerodynamic diameter ; , particulate matter with an aerodynamic diameter . PNC, particle number concentration; , PNC of particles with mobility diameter; , PNC of particles with mobility diameter; , PNC of particles with mobility diameter; , PNC of particles with mobility diameter; PSC, particle surface concentration.

