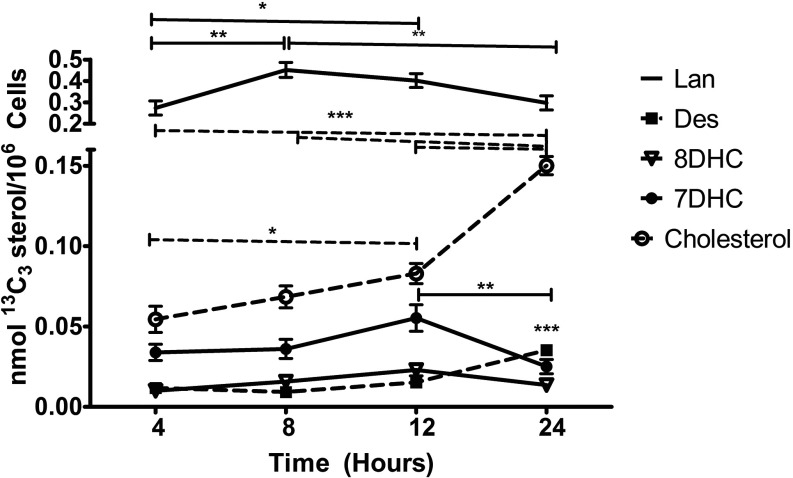
Figure 13.
De novo synthesis of cholesterol and sterol precursors was accomplished by incubating hiPSC-derived neuroprogenitor cells with for 24 h and monitoring for at indicated time points. Isotopically labeled sterols analyzed are lanosterol (solid line), desmosterol (solid square, dashed line), 8-DHC (open triangle, solid line), 7-DHC (solid circle, solid line), and cholesterol (open circle, dashed line). Three distinct differentiations were conducted for each donor and averaged; shown is the average of the three donors (). *, **, *** as determined by repeated measures one-way analysis of variance (ANOVA).

