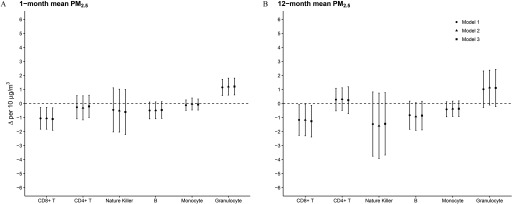
Figure 3.
Pooled difference in leukocyte composition (; %) per increase in (A) 1- and (B) 12-month mean concentrations among participants, Women’s Health Initiative (1993–2002) and Atherosclerosis Risk in Communities (1990–1995) study. Model 1 adjusted for race/ethnicity, age, sex (in ARIC), randomly assigned treatment group (in WHI), mean temperature, mean dew point, mean barometric pressure, season, and subpopulation-specific covariates. Model 2 also adjusted for individual-level education and neighborhood socioeconomic status. Model 3 additionally adjusted for smoking status, alcohol use, body mass index, and physical activity.

