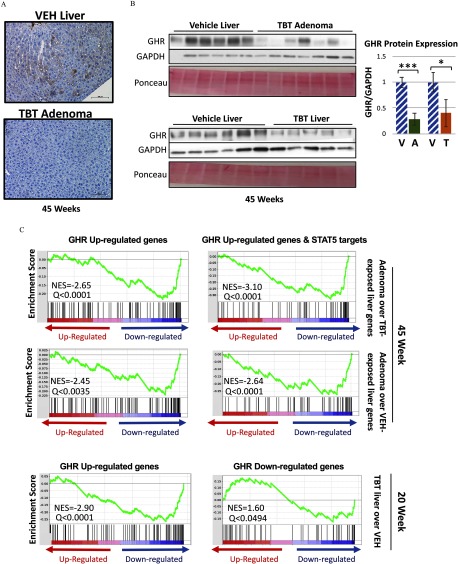
Figure 6.
Expression of members of the growth hormone receptor (GHR)/STAT5 signaling pathway in male mice developmentally exposed to tributyltin. (A) Representative images of immunohistochemical staining of major urinary protein 1 (MUP1) protein in vehicle (VEH)-treated liver and adenomas from tributyltin (TBT)-treated 45-week-old male mice (; scale bars:). (B) Immunoblot analysis of growth hormone receptor (GHR) protein levels in liver tissue from VEH- () and TBT-exposed () males and adenoma tissue from TBT-exposed males () at 45 weeks of age (left panels) with quantitation of the immunoblots (right panels). GHR level was normalized to GAPDH protein level in each lysate. Ponceau stain is displayed beneath each blot. Bars represent the . *, **, *** by t-test. (C) Gene Set Enrichment Analysis (GSEA) based on the transcriptomic footprint of TBT-induced adenomas vs. TBT- or VEH-exposed age-matched liver at 45 weeks using a publicly available GHR gene signature (GSE93382), either for all up-regulated genes (left) or the up-regulated genes that are also direct STAT5 targets (identified by STAT5 ChIP-Seq GSE31578, right). The 20-week transcriptome of male liver tissue was also analyzed for both up-regulated and down-regulated GHR genes (bottom panels). Significance was achieved at an FDR-adjusted Note: A, adenoma; T, TBT-treated males without any macroscopic adenomas; V, hatched, VEH-exposed liver.

