
Figure 2.
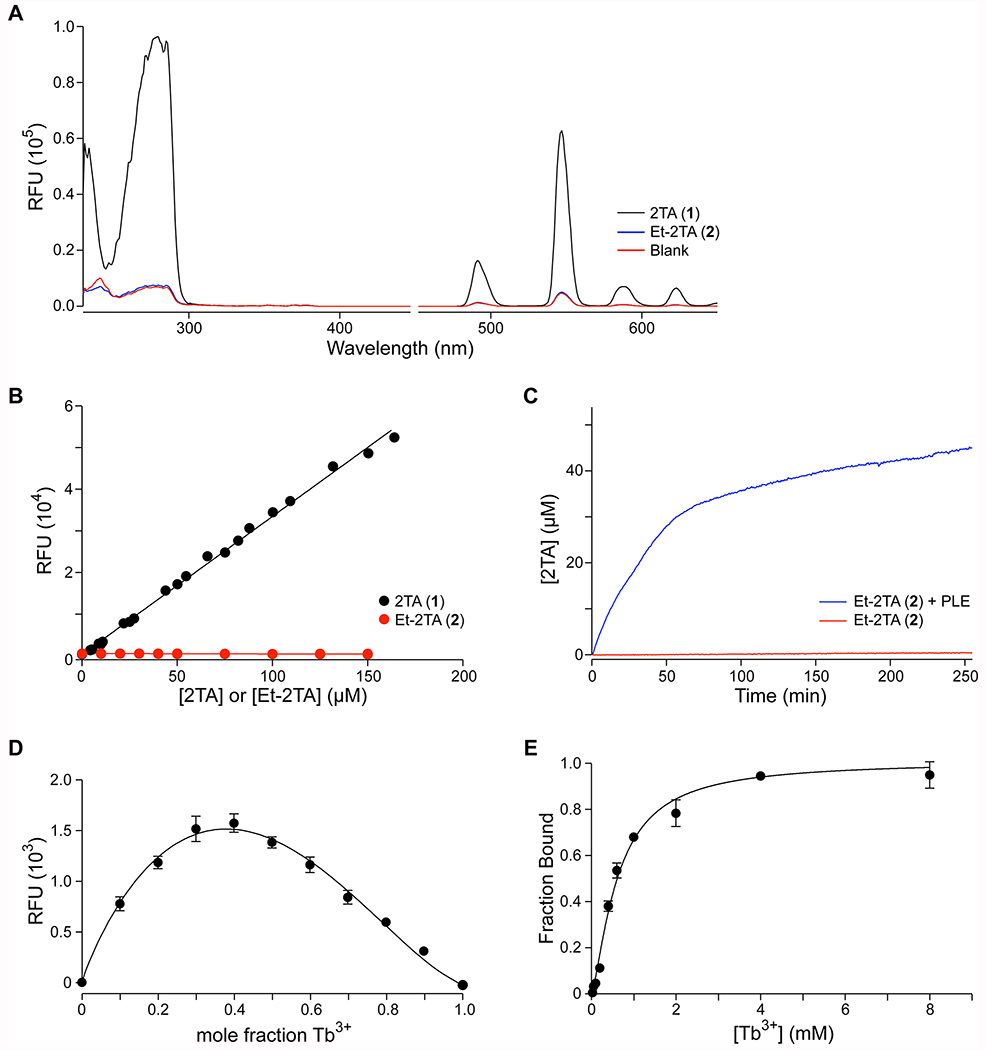
Using Tb3+ complexation to monitor the cleavage of 2TA esters. (A) Excitation (<450 nm) and emission (>450 nm) spectra of 2TA and Et-2TA (150 μM) in 5 mM HEPES–NaOH buffer, pH 7.4, containing TbCl3 (4 mM), Triton X-100 (0.1% w/v), and TOPO (350 μM). (B) Dependence of emission intensity on the concentration of 2TA (slope = 326; R2 = 0.9966) or Et-2TA (slope = −0.9; R2 = 0.9101). (C) Time-dependence of the effect of PLE on the production of 2TA from Et-2TA. (D) Job Plot of 2TA and Tb3+ (χ = 0.38 ± 0.03). (E) Titration of 2TA (50 μM) with Tb3+; data fitted with eq 4 (apparent Kd = 620 ± 24 μM; h = 1.40 ± 0.07). Values in panels D and E are the mean ± SD from triplicate measurements.