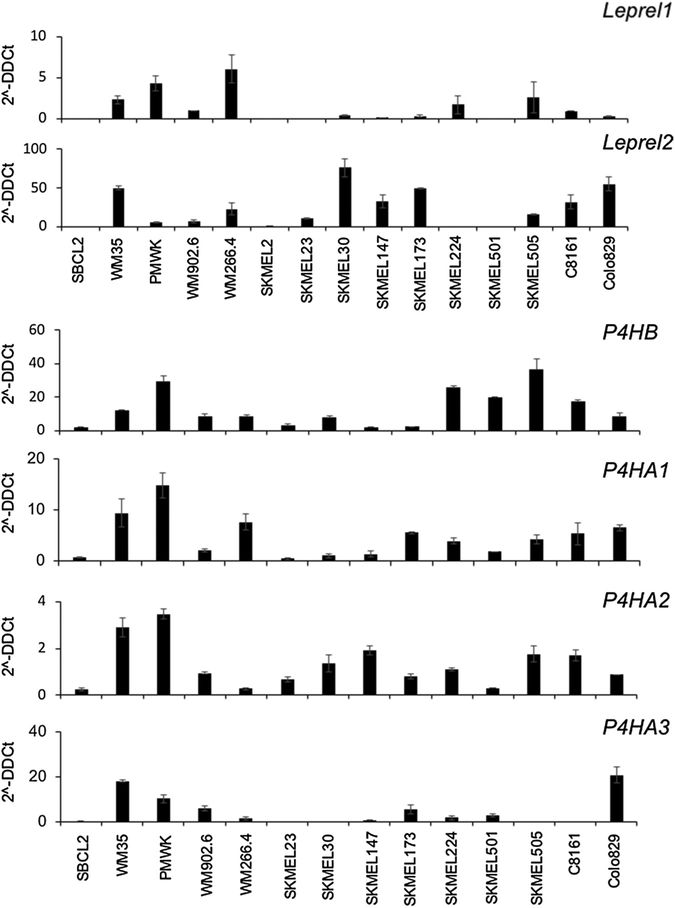
Figure 1. Expression of C-P3H and C-P4H genes in melanoma cell lines.
Quantitative PCR analysis of each C-P3H and C-P4H genes in the melanoma cell line panel. cDNA was prepared and quantitative PCR performed as described in Materials and Methods. Expression is shown as 2-ΔΔCt calculated as described in Materials and Methods. Data shown are mean ± 1 standard deviation. Each experiment was performed in triplicate and repeated at least twice.

