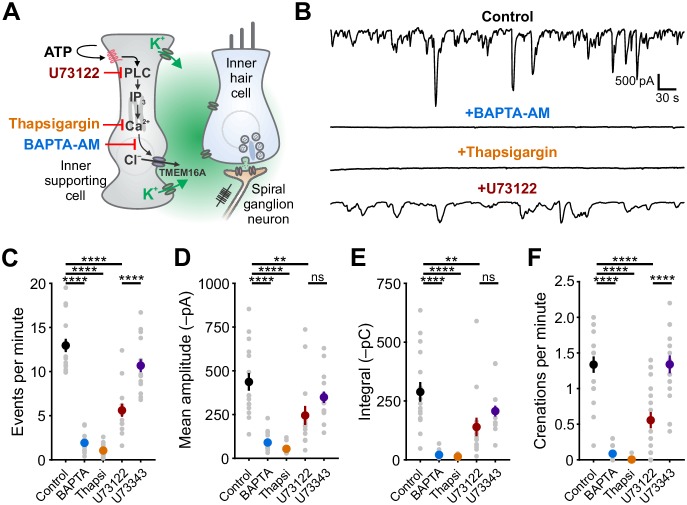
Figure 1. Ca2+ release from intracellular stores is required for spontaneous currents and crenation in inner supporting cells.
(A) Model of ATP-mediated depolarization of inner hair cells. ATP: adenosine triphosphate, PLC: phospholipase C, IP3: inositol triphosphate, TMEM16A: transmembrane member 16A (Ca2+-activated Cl– channel). Inhibitors of key steps in this pathway are indicated. (B) Whole-cell voltage-clamp recordings from inner supporting cells after pre-incubating with indicated inhibitors. (C) Quantification of ISC spontaneous current frequency in the presence of the indicated inhibitors. Data shown as mean ± SEM. n = 16 cells, 11 cochleae from six postnatal day (P) 6–8 rats (control), 18 cells, 10 cochleae from five rats (BAPTA-AM; 100 μM), 20 cells, 11 cochleae from six rats (Thapsigargin; 2 μM), 14 cells, 11 cochleae from seven rats, (U73122; 10 μM), and 16 cells, 10 cochleae from five rats (U73343; 10 μM). ****p<5e-5, one-way ANOVA. (D) Quantification of ISC spontaneous current amplitude in the presence of indicated inhibitors. Data shown as mean ± SEM. n values are reported in (C) (one-way ANOVA; ****p<5e-5, **p<0.005, ns: not significant). (E) Quantification of ISC spontaneous current charge transfer (integral) in the presence of indicated inhibitors. Data shown as mean ± SEM. n values are reported in (C) (one-way ANOVA; ****p<5e-5, **p<0.005, ns: not significant). (F) Quantification of ISC crenation (cell shrinkage) frequency in the presence of indicated inhibitors. Data shown as mean ± SEM. n = 19 videos, 11 cochleae from six rats (control), 15 videos, 8 cochleae from four rats (BAPTA-AM), 22 videos, 12 cochleae from six rats (Thapsigargin), 23 videos, 17 cochleae from 10 rats (U73122), and 20 videos, 10 cochleae from five rats (U73343) (one-way ANOVA; ****p<5e-5, **p<0.005, ns: not significant). See Figure 1—source data 1 for plotted values and statistics.


