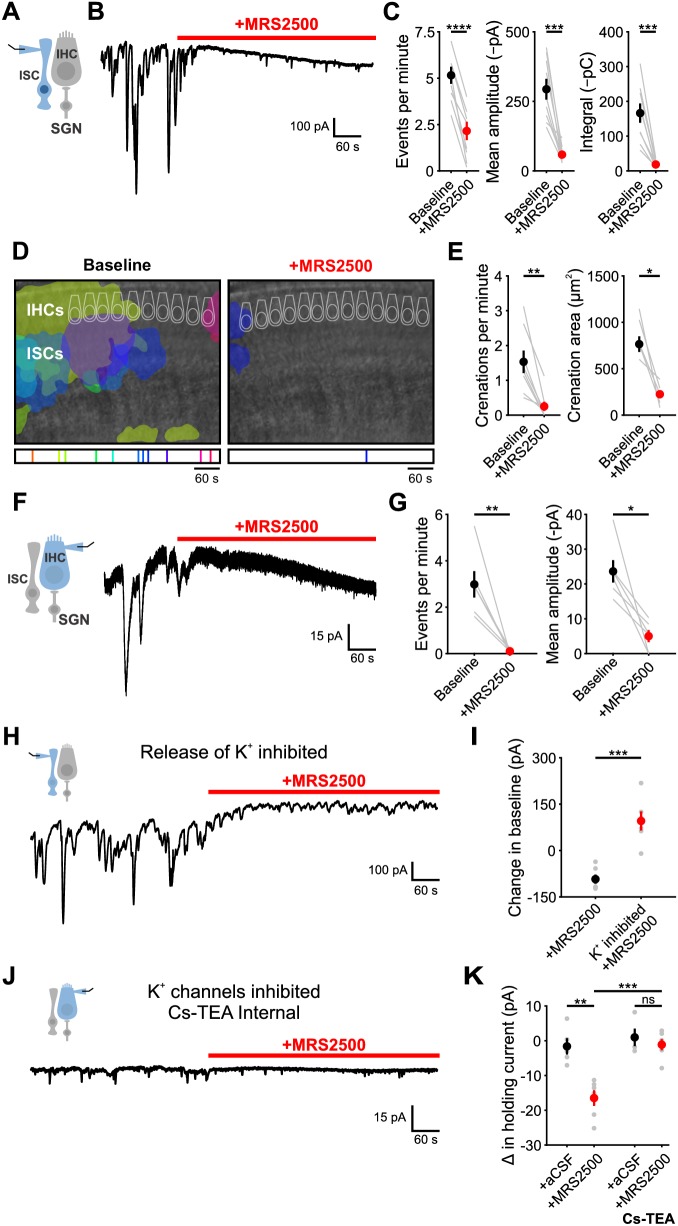
Figure 3. P2Y1 inhibition abolishes spontaneous currents in inner supporting cells and inner hair cells.
(A) Schematic of whole-cell recording configuration from ISCs. (B) Spontaneous inward currents recorded from an inner supporting cell before and during application of MRS2500 (1 μM). Recordings were performed at room temperature (~25°C). (C) Plot of event frequency, amplitude, and integral (charge transfer) before and after application of MRS2500. Measurement periods were five minutes long. n = 9 ISCs, 9 cochleae from 8 P6-8 mice (two-tailed paired Student’s t test; ****p<5e-5, ***p<0.0005) (D) Intrinsic optical imaging performed before and after application of the P2RY1 antagonist, MRS2500 (1 μM). Detected crenations are outlined in colors based on time of occurrence as indicated by timeline below image. Imaging was performed at room temperature (~25°C). (E) Plot of crenation frequency and area before and after application of MRS2500. n = 8 videos, 8 cochleae from 8 P6-8 mice (two-tailed paired Student's t test; **p<0.005) for frequency calculation and n = 5 cochleae (two-tailed paired Student's t test; *p<0.05) for area calculation. Cochleae that did not crenate after MRS2500 were excluded from the area calculation. (F) Schematic of whole-cell recording configuration from IHCs. (right) Whole-cell voltage clamp recording from an IHC before and during application of MRS2500. (G) Plots of event frequency and amplitude before and after application of MRS2500. n = 6 IHCs, 6 cochleae from 6 P6-8 mice (two-tailed paired Student's t test with Bonferroni correction; **p<0.005, *p<0.05). (H) Whole-cell voltage clamp recording of an ISC with application of MRS2500 following pre-incubation in aCSF containing CdCl2 (100 μM), TTX (1 μM), ouabain (10 μM), and bumetanide (50 μM) to limit potassium release into the extracellular space. (I) Plot of the change in holding current, defined as the 95% percentile current value for each period. n = 6 ISCs, 6 cochleae from 6 P6-8 mice for each condition (two-tailed Student’s t test; ***p<0.0005). (J) Whole-cell voltage clamp recording of an IHC with a Cs-TEA internal solution (to inhibit K+ channels) before and after MRS2500 application. (K) Plot of the change in IHC holding current following control (superfusion of aCSF only) and MRS2500 with K-MeS and Cs-TEA internal. n = 5 IHCs, 4 cochleae from 4 P6-8 mice for aCSF, n = 6 IHCs, 6 cochleae from six mice for MRS2500, n = 4 IHCs, 3 cochleae from three mice for aCSF with Cs-TEA internal, and n = 6 IHCs, 6 cochleae from six mice for MRS2500 with Cs-TEA internal (one-way ANOVA; ***p<0.005, **p<0.005, ns, not significant). See Figure 3—source data 1 for plotted values and statistics.


